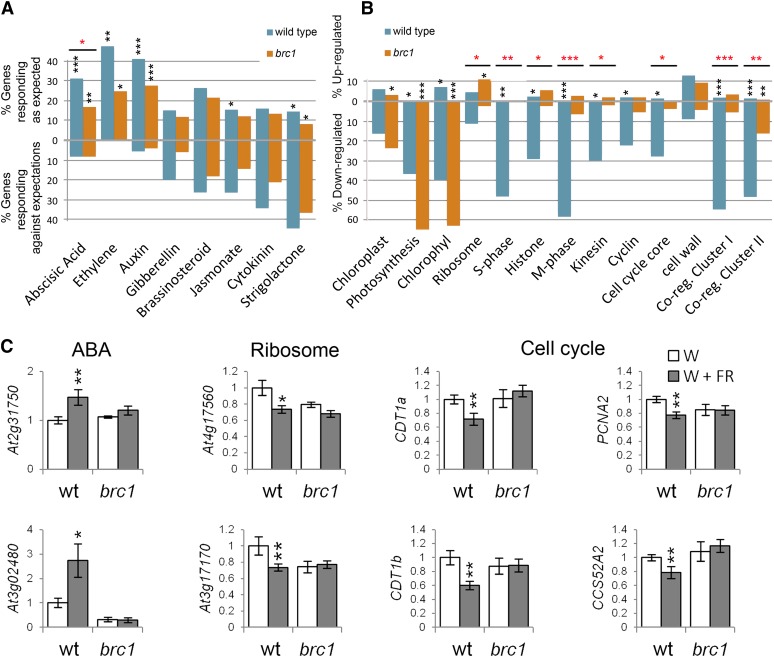
Figure 4.
Transcriptomic Response of Wild-Type and brc1 Mutant Axillary Buds to Low R:FR.
(A) Global response of hormone marker genes in wild-type and brc1 buds treated with W+FR. Top, percentage of hormone marker genes responding as expected after a hormone treatment (Nemhauser et al., 2006; Mashiguchi et al., 2009). Bottom, percentage of hormone marker genes responding opposite to expected after hormone treatment.
(B) Global responses of gene categories. Black asterisks indicate statistically significant differences with the expected distribution in nontreated tissue (A) and statistically significant differences with the response of a random gene collection (B). Red asterisks indicate statistically significant differences between wild-type and brc1 responses ([A] and [B]). *P < 5⋅10−3; **P < 5⋅10−6, and ***P < 5⋅10−9. NABA = 777, NEth = 57, NAuxin = 259, NGA = 121, NBr = 61, NJA = 749, NCk = 76, NSL = 69, NChpl = 68, NPh = 41, NChl = 43, NRib = 413, NS-ph = 50, NHis = 93, NM-ph = 79, NKin = 57, NCyc = 113, NCell-cyc-core = 83, Ncell-wall = 656, NCR-ClusterI = 187, and NCR-ClusterII = 168.
(C) Relative mRNA levels of representative genes of the categories ABA, ribosome, and cell cycle analyzed by qPCR. Error bars are se. Asterisks represent significant differences (Student’s t test, *P < 0.1 and **P < 0.05) between W- and W+FR-treated plants. wt, the wild type.
[See online article for color version of this figure.]

