Figure 4.
MAP18 Binds to F-Actin and Severs F-Actin in a Ca2+-Dependent Manner in Vitro.
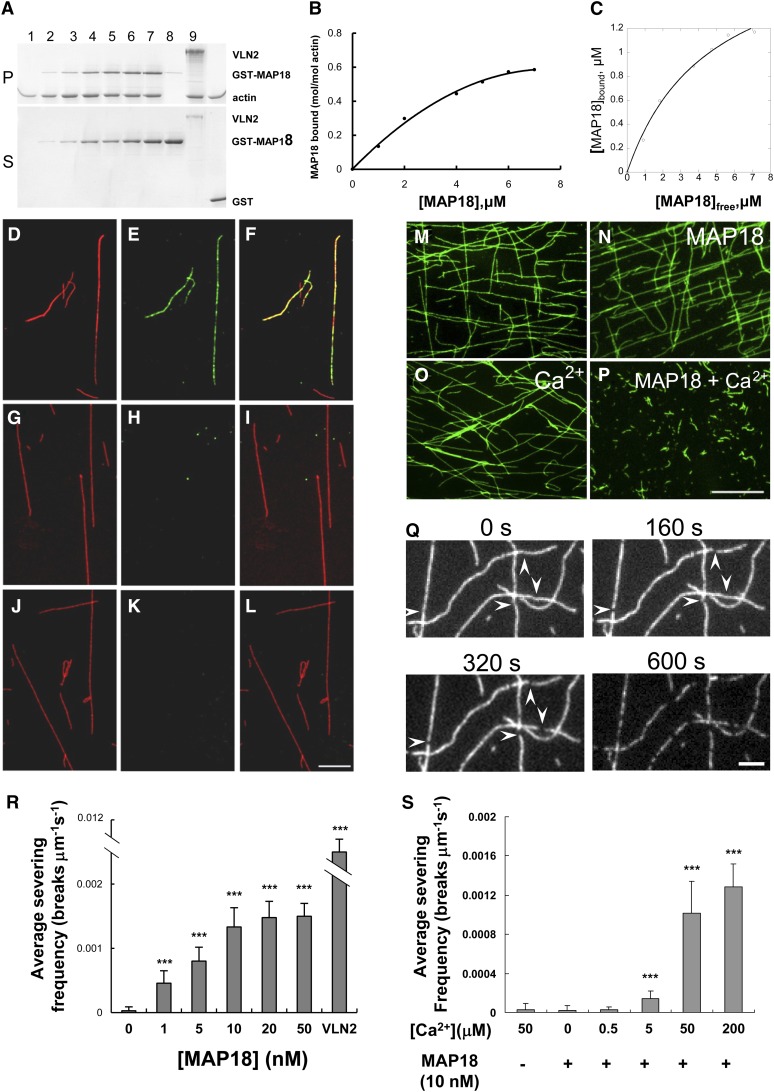
(A) A cosedimentation assay was performed to assess GST-MAP18 binding to actin filaments. Preformed F-actin was incubated with various concentrations of recombinant GST-MAP18. Positive control, VLN2; negative control, GST. GST-MAP18 binds to F-actin in vitro. Lanes 1 to 7, 0, 1, 2, 4, 5, 6, and 7 μM GST-MAP18; lanes 1 to 6, 8, and 9: 2 μM F-actin; lane 8, 3.5 μM VLN2; lane 9, 7 μM GST. Experiments were repeated at least three times and a representative result is shown. P, pellets; S, supernatants.
(B) Densitometry analysis of the results shown in (A). Binding to F-actin is saturated at a stoichiometry of 0.58 mol GST-MAP18 per mol of G-actin.
(C) The amount of MAP18 in the pellet (bound) was plotted against the amount of MAP18 in the supernatant (free) and fitted with a hyperbolic function. This experiment was repeated more than three times, and the mean value of the calculated dissociation constant (Kd) was 0.26 ± 0.04 μM. For this representative experiment, the Kd value was 0.22 μM.
(D) to (L) In vitro immunofluorescent microscopy demonstrated that GST-MAP18 colocalizes with F-actin. GST-MAP18 was incubated with Alexa 488–phalloidin–stabilized F-actin (pseudocolored red) and was then stained with anti-MAP18 primary antibody and tetramethylrhodamine isothiocyanate–conjugated goat anti-rabbit secondary IgG (pseudocolored green). Bar in (L) = 5 μm for (D) to (L).
(D), (G), and (J) F-actin.
(E) GST-MAP18.
(H) Denatured MAP18.
(K) Secondary antibody alone (negative control).
(F) Merged image of (D) and (E).
(I) Merged image of (G) and (H).
(L) Merged image of (J) and (K).
(M) to (P) Preformed actin filaments (labeled with Alexa 488–phalloidin) remain intact when incubated with 10 nM GST-MAP18 (N) or 50 μM Ca2+ (O). Actin filaments are fragmented in the presence of GST-MAP18 together with 50 μM Ca2+ (P). Bar in (P) = 10 μm for (M) to (P).
(Q) Time-lapse images taken from Supplemental Movie 4 online showing the severing activity of MAP18. TIRFM imaging was started right after the addition of MAP18 and 50 μM Ca2+ to the system. Each individual filament displayed an increasing number of breaks (arrowheads) as time elapsed. Bar = 2 μm.
(R) The mean severing frequencies were plotted against the concentration of MAP18 (in the presence of 50 μM Ca2+). MAP18 severs actin filaments in a dose-dependent manner. There is no obvious increase of the severing frequencies when the concentration of MAP18 was over 10 nM. The mean severing frequency of 5 nM VLN2 was used as a positive control. Experiments were repeated at least three times. Each experiment examined more than 15 filaments. Error bars represent ± sd. ***P < 0.001 by Student’s t test in comparison to 0 nM MAP18.
(S) F-actin severing frequencies of 10 nM MAP18 in the presence of various concentrations of Ca2+. Experiments were repeated at least three times. More than 15 filaments were examined for each experiment. Error bars represent ± sd. ***P < 0.001 by Student’s t test in comparison with the control.

