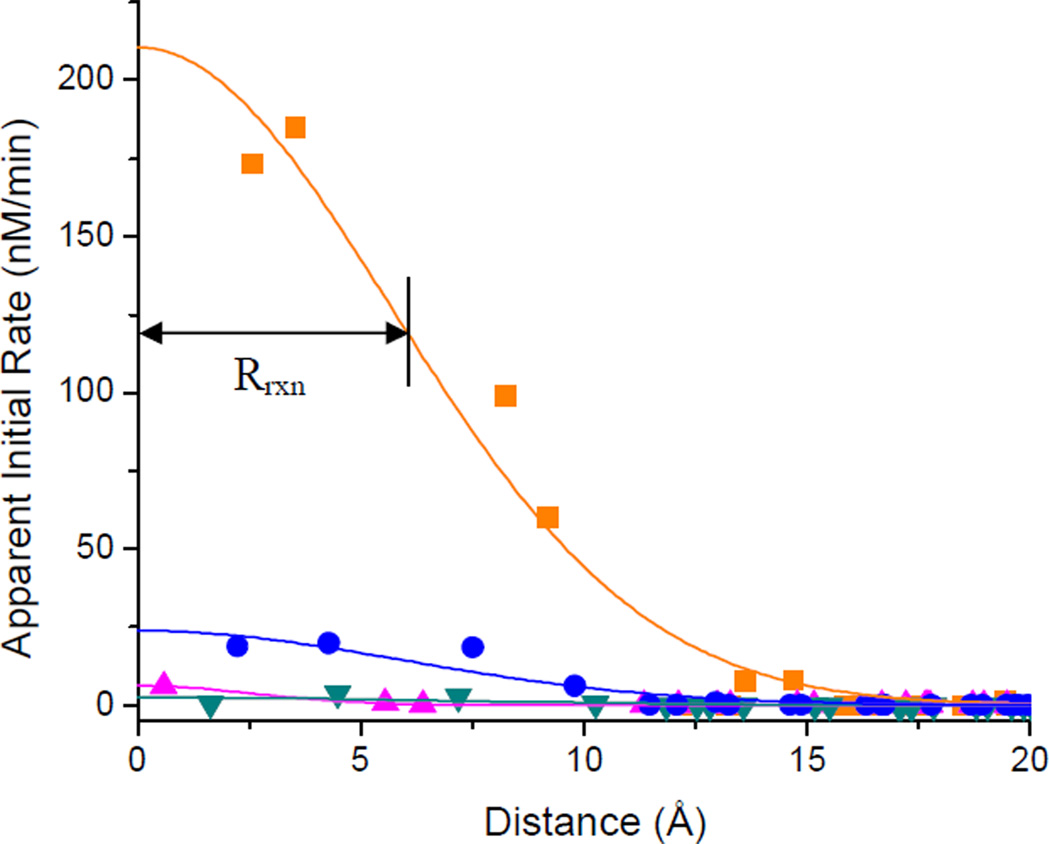
Figure 9.
Dependence of the apparent rate of 4’-H abstraction on the distance from the metal center for each M-chelate-Rev catalyst (with 1 mM ascorbate/H2O2). A Gaussian radius (Rrxn) was calculated for each curve. The M-EDTA-Rev species shown here are: Fe-EDTA-Rev, orange ■; Co-EDTA-Rev, pink ▲; Ni-EDTA-Rev, green ▼; Cu-EDTA-Rev, blue ●.

