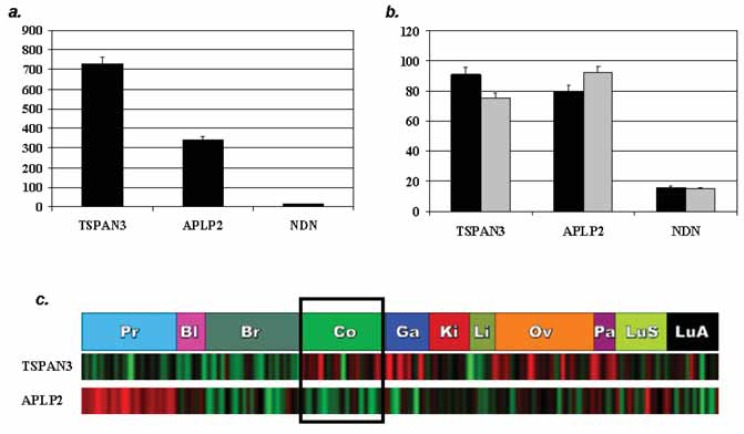
Figure 3.
TSPAN3 and APLP2 are expressed in normal and neoplastic colon. Expression of TSPAN3, APLP2 and NDN in microarray profiles of: (a) normal colon (Log2 of user-provided count of gene expression on oligonucleotide microarray (Affymetrix U133) using pooled RNA) (b) primary colon cancer cell line (black bars) and metastatic colon cancer cell line (grey bars) (Log2 of user-provided count of gene expression on oligonucleotide microarray (Affymetrix U133) using pooled RNA) (c) 174 human epithelial tumors (Co; colon samples, red, increased gene expression; green, decreased expression; black, median level of gene expression. The color intensity is proportional to the hybridization intensity of a gene from its median level across all samples.

