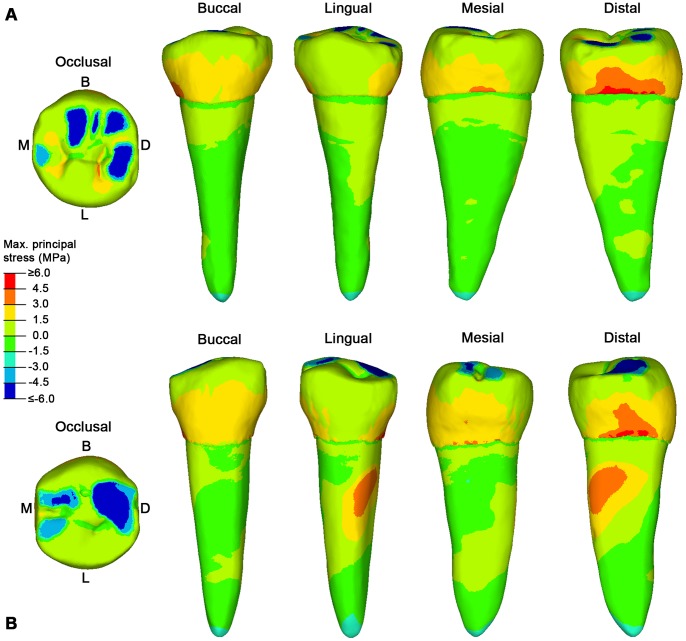
Figure 3. The maximum principal stress distribution for specimen S5 and S126 lower right second premolars (RP2).
A, specimen S5 in occlusal, buccal, lingual, mesial and distal view. B. specimen S126 in occlusal, buccal, lingual, mesial and distal view. Blue spots in the occlusal surface (compressive stress) represent the contact areas with the antagonistic teeth, during maximum intercuspation (see Video S3 for specimen S5, and Video S4 for specimen S126), where the load was applied. Red spots represent tensile stresses. B, buccal; D, distal; L, lingual; M, mesial.

