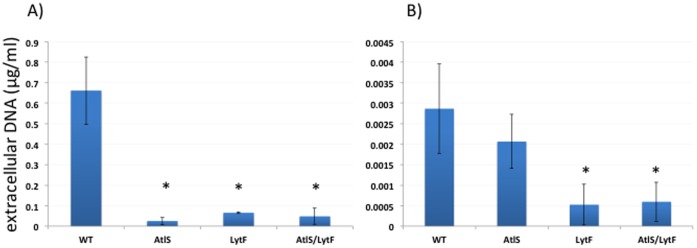
Figure 6. Release of eDNA during aerobic growth and as a result of H2O2 treatment.

A. Wild type, AtlS, LytF and AtlS/Lytf mutant were grown until early stationary phase under aerobic conditions and the eDNA in the supernatant determined using Real-Time PCR. B. Cells were grown as static cultures under non-producing conditions and 2 mM H2O2 added after cells reached an A600 of 0.3. After further incubation of 5.5 hours, the eDNA concentration was determined in the supernatant using Real-Time PCR. Error bars represent standard deviations from the mean (n = 3). Asterisks indicate statistically significant differences (p = 0.05) in the eDNA concentration in comparison to the wild type.
