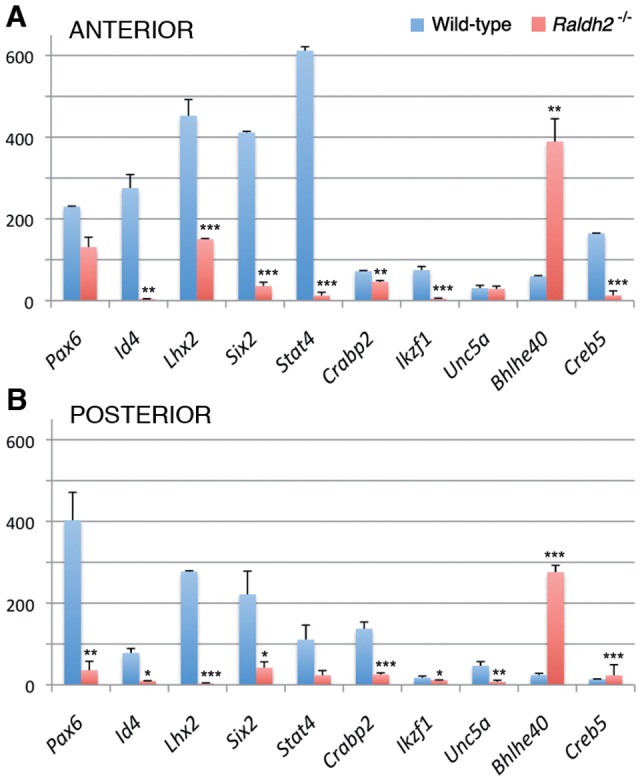
Figure 4. Microarray validation by quantitative real-time RT-PCR (Q-PCR).

Genes were selected according to their different expression profiles as detected by microarray analysis of wild-type (WT) and Raldh2 −/− embryos. Among these, one gene (Pax6) was chosen as a “control”, as its expression had already been shown to be affected in Raldh2 −/− embryos (see main text for details and interpretation of the data). Expression levels are expressed as values normalized with respect to Gapdh (a housekeeping gene) mRNA levels (WT samples, blue bars; Raldh2 −/− samples, red bars). Data (mean ± SEM) were analyzed with Student t-test; ***, p<0.001; **, p<0.01; *, p<0.05.
