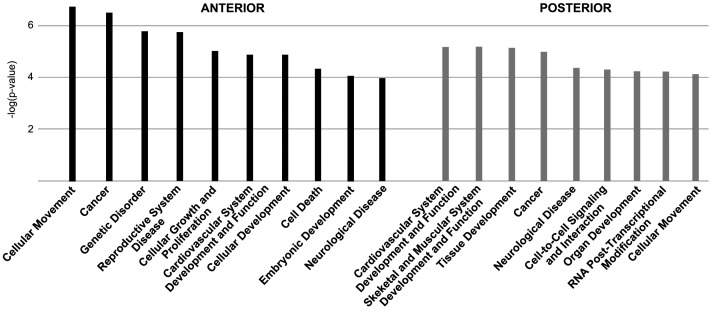
Figure 6. Overview of the main biological and physiological functions correlating with the affected genes in Raldh2 −/− embryos.
The functions are listed by decreasing order of statistical significance [−log(p-values)] of differentially expressed and misregulated genes as calculated by the Ingenuity software. Left side (black bars): ANT microarray data; right side (gray bars): POST microarray data.

