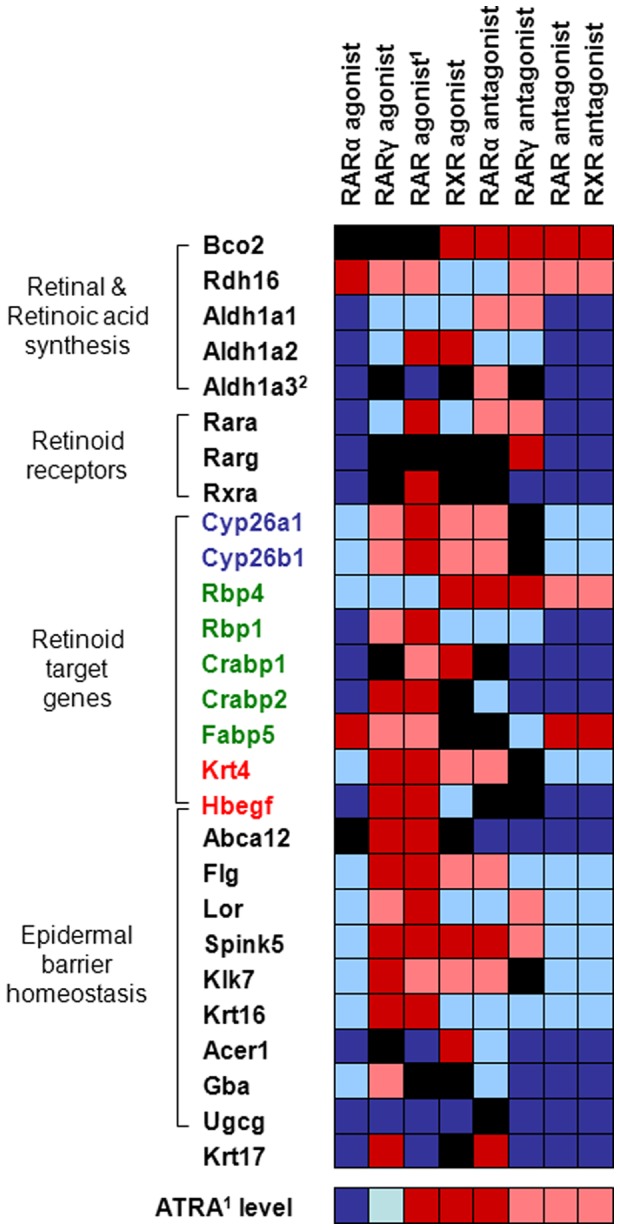
Figure 3. Altered gene expression after treatment with retinoid receptor-specific agonists and antagonists.

Heat map displaying fold change of gene expression in mouse skin (n≥5/group) after treatment with retinoid receptor-specific agonists and antagonists compared to control mice (acetone). Genes are differentiated according to roles in retinoid metabolism or epidermal homeostasis. Retinoid target genes are further distinguished by specific function, i.e. retinoic acid synthesis (blue), retinoid transport (green), and genes unrelated to retinoid signaling (red). Color codes: dark red – significantly up-regulated; light red – non-significantly up-regulated; black – not regulated (±20%); light blue – non-significantly down-regulated; dark blue – significantly down-regulated. Statistical significance (p) is based on one-way ANOVA followed by Dunnett’s post test. A p-value <0.05 was considered significant. 1all-trans retinoic acid; 2also relevant as retinoid target gene.
