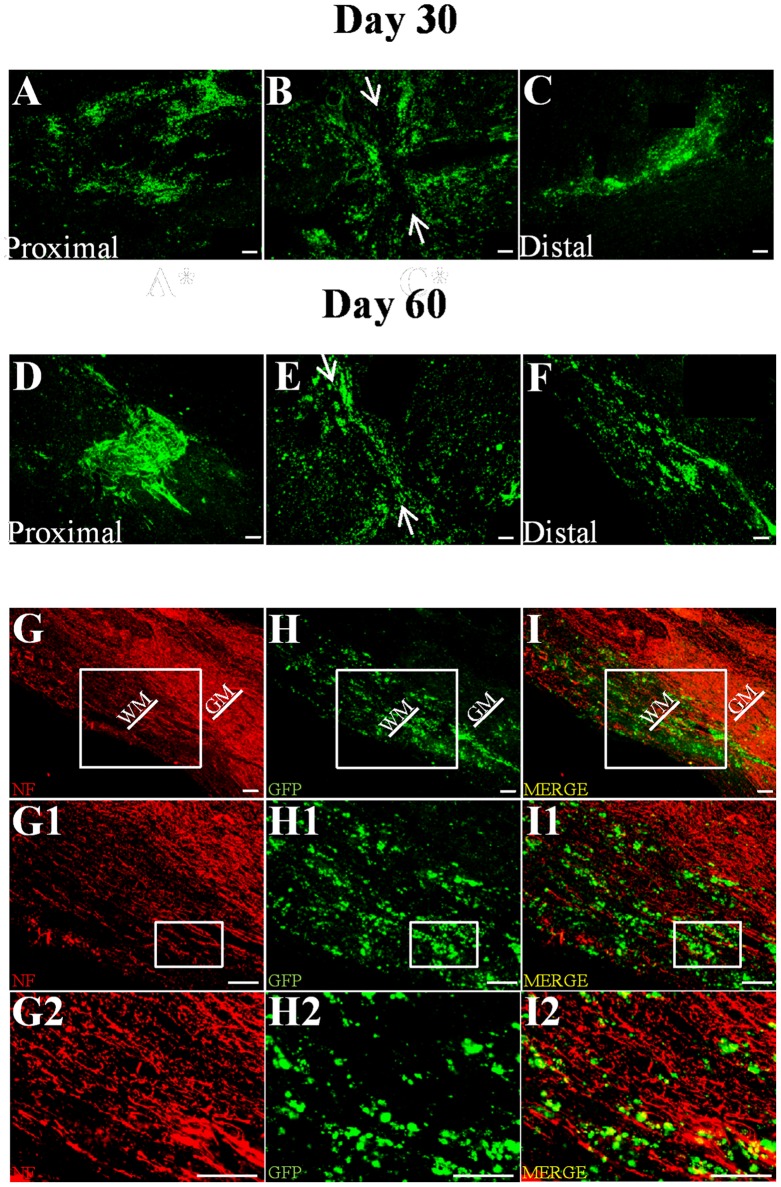
Figure 7. Tracking of GFP+ OM-OECs.
Tracking of GFP+ OM-OECs performed on longitudinal sections revealed that 30 (A–C) and 60 (D–F) days after transplantation, OECs could be found at the injury site (B and E) and both proximally (A and D) and distally (C and F) to the injection site. White arrows represent the lesion site. GFP/neurofilament co-staining shows that OECs are closely associated to neurofilament+ fibers (G–I2), 30 and 60 days after surgery. Scale bar = 100 µm. WH = White Matter and GH = Grey matter. Illustrations are representative of three different animals for each time point.

