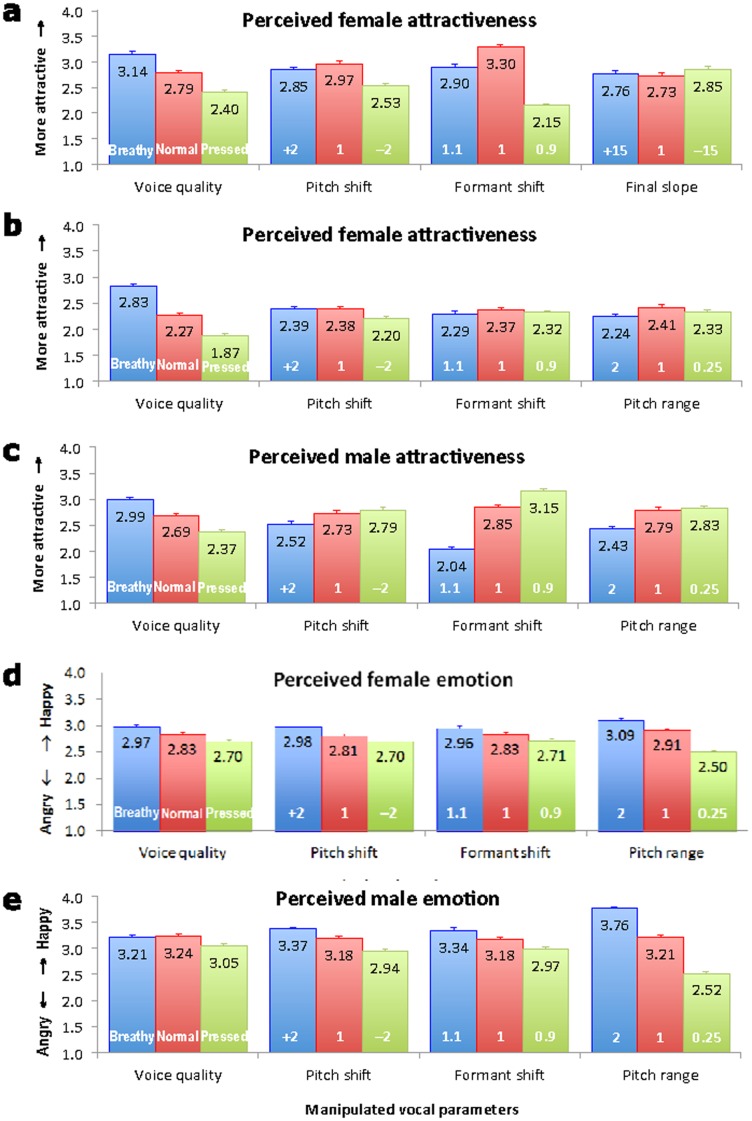
Figure 2. Judgment ratings.
Judgments of voice attractiveness (a–c) and emotion (d–e), on a scale of 1–5, as a function of Voice quality, Pitch shift, Formant shift, Final F0 slope and Pitch range. Each row of the graphs (a–e) corresponds to Experiments 1–5 respectively. In each bar, the black figures represent mean rating score, while parameter values are in white. The error bars are standard errors.

