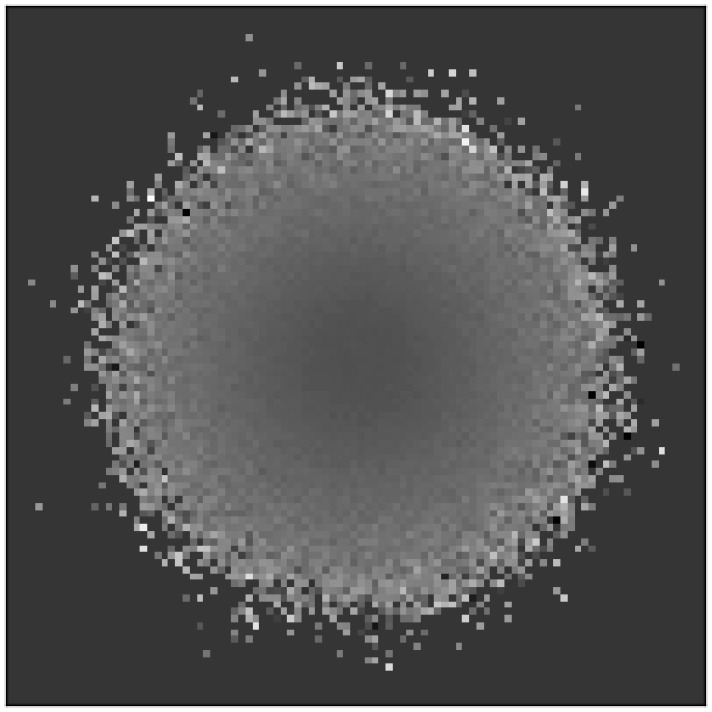
Figure 2. Evolvability heat map for the abstract passive drift model.
The average evolvability of organisms in each niche at the end of a simulation is shown averaged over 50 independent runs. The lighter the color, the more evolvable individuals are within that niche. The overall result is that evolvability increases with increasing distance from the starting niche in the center.

