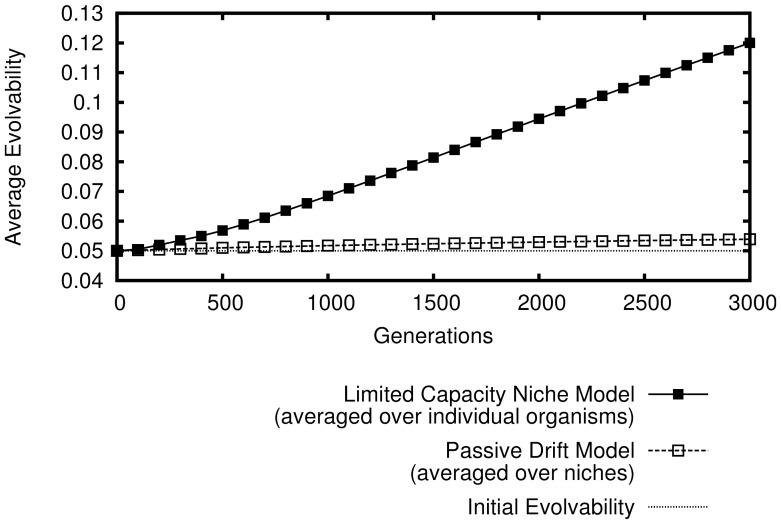
Figure 5. True increasing evolvability in the abstract model with limited capacity niches.
How the average evolvability of organisms in the population changes over time is shown (averaged over 50 independent simulations that lasted 1000 generations each). Note that the line shown for the passive model (reproduced from figure 0) represents only the appearance of increasing evolvability in that model when evolvability is averaged over niches.

