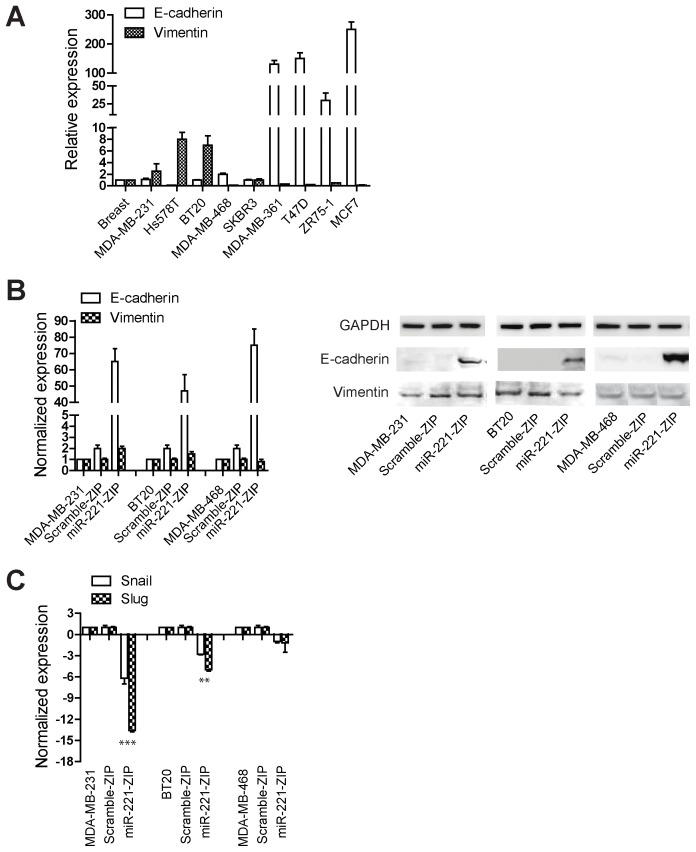
Figure 4. Down regulation of miR-221 increases E-cadherin levels and decreases the expression levels of Snail and Slug.
(A) The RNA expression level of E-cadherin and vimentin was measured in a panel of breast cancer cell lines. Fold changes are recorded as normalized to normal breast tissue levels. (B) E-cadherin and vimentin expression levels were measured in MDA-MB-231, BT-20, MDA-MB-468 parental cells, as well cells harboring miR-221-ZIP, or scramble-ZIP. Data are normalized to the expression level in parental cells. Western blot analysis was also performed to examine the protein levels of E-cadherin and vimentin. (C) Snail and Slug expression levels were also examined in MDA-MB-231, BT-20, and MDA-MB-468 cells. Data were normalized to the expression level in parental cells and fold changes were plotted. ***denotes p<0.005. **denotes p<0.01.

