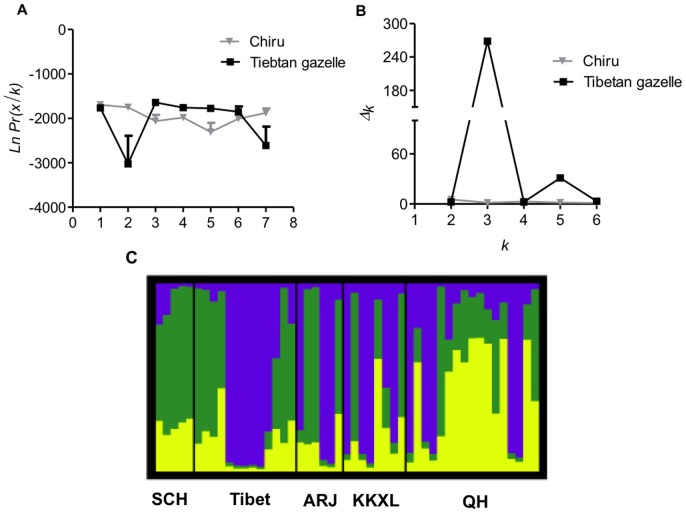
Figure 4. K, delta K scores and Q-plot.
A) & B) K and delta K scores of the chiru (Pantholops hodgsonii) and Tibetan gazelle (Procapra picticaudata). The scores are based on microsatellite data with all loci included and prior assumptions of 1–7 genotypic clusters (K); C) Q-plot of the Tibetan gazelle (Procapra picticaudata) at K = 3.

