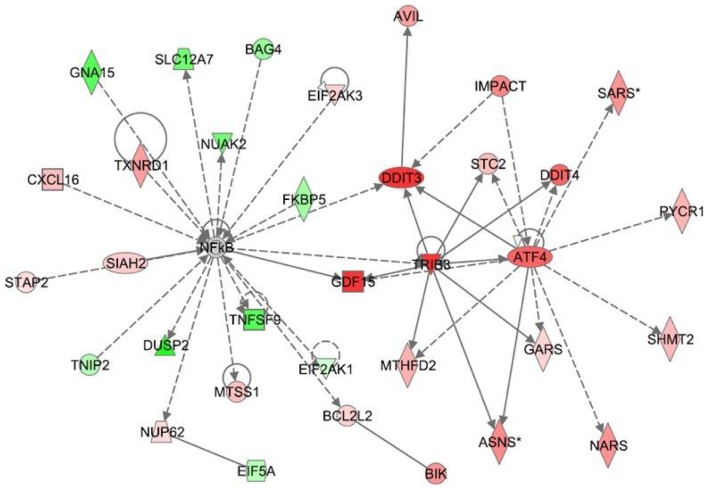
Figure 2. Ingenuity Interactome analysis of the effect of CBD on LPS-affected gene expression.
Network analysis of the genes whose expression was affected by LPS+CBD vs LPS was performed using the Ingenuity software. Each network displays the genes/gene products as nodes (different shapes representing the functional classes of gene products) and the biological relationships between the nodes as lines. The length of each line reflects the amount of literature evidence supporting this node-to-node relationship. The color intensity of each node indicates the degree of upregulation (red) or downregulation (green) of the respective gene transcript. Genes in gray have been shown (in the literature) to interact with the colored gene products that appear in this scheme. Network 1: The NFκB-ATF4 interactome – Interaction between the CBD-upregulated Trib3 and the attenuation of the NF-κB transcription factor (responsible for the transcription of many proinflammatory genes) shows the connection of this network to anti-inflammatory responses.

