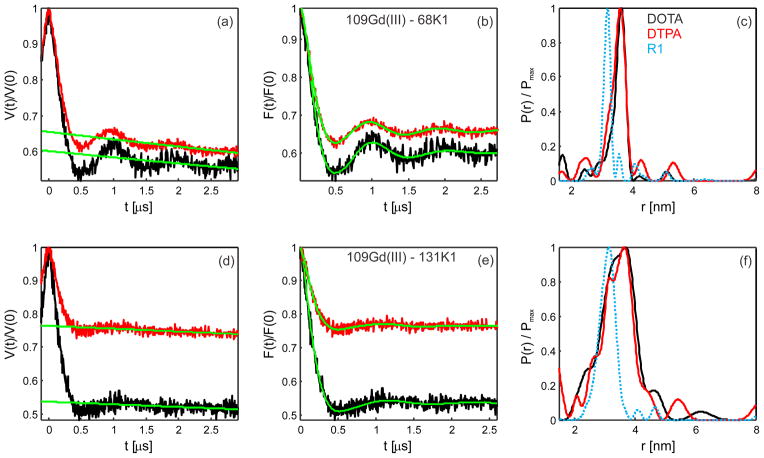
Figure 3.
Q-band DEER measurements of [Gd(DOTA)]-nitroxide (black) and [Gd(DTPA)]− -nitroxide (red) labeled T4-lysozyme. On the top, (a), (b) and (c) results for 109 Gd(III) – 68 K1. On the bottom, (d), (e) and (f) results for 109 Gd(III) –131 K1. (a, d) Primary DEER time traces with background functions (green), (b, e) background-corrected form factors traces and (c, f) the obtained distance distributions as calculated by DeerAnalysis 2011. Best fits (b, e, in green) were obtained with a Tikhonov regularization parameter of 10 with a model-free fitting. The nominal flip angle for the pump pulse was set to π. The dotted-cyan distance distribution (c, f) was obtained in samples doubly-labeled with the R1 side chain. DEER experiments were performed at 10K with d1 = 400 ns and d2 = 3200 ns.

