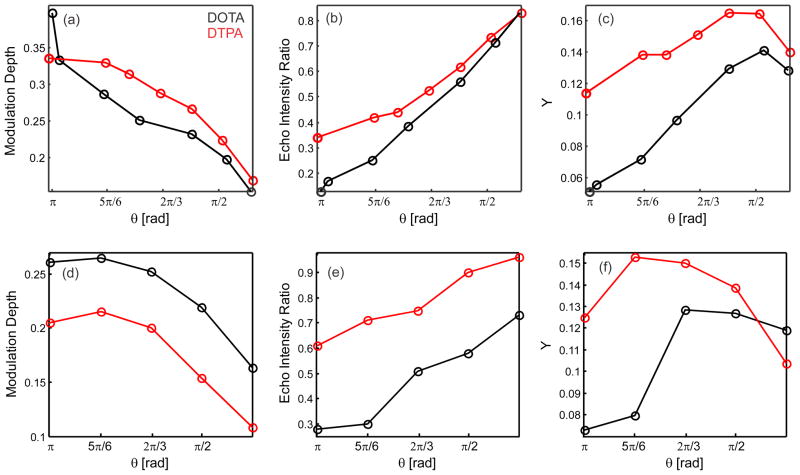
Figure 5.
Variation of the Gd(III)-nitroxide DEER modulation depth (a, d) and of the echo intensity ratio (b, e) as a function of the flip angle θ for the pump pulse. The echo intensity ratios were calculated by measuring the DEER echo with and without pump pulse. The value Y (c, f) is the product between the DEER modulation depth and the echo intensity ratio. This value represents the relative S/N ratio for the corresponding DEER experiment. A first series with constant pump pulse length of 12 ns and with variation of microwave power for the pump pulse is presented in (a–c), a second series with constant microwave power for the pump pulse (optimal value from the first series) and with variation of the pump pulse duration is shown in (d–f). Data were obtained for 109 Gd(III) - 68 K1. Results for [Gd(DOTA)] and [Gd(DTPA)]− are shown in black and red respectively. Q-band DEER traces were obtained at 10 K.

