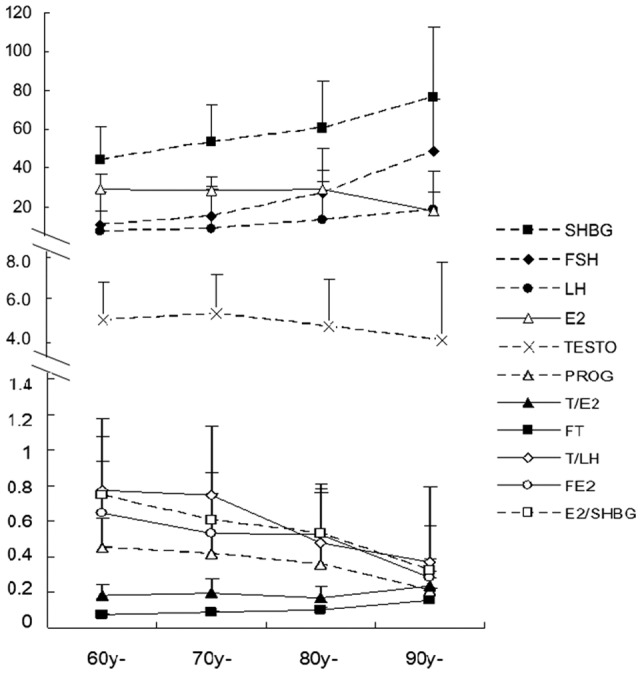
Figure 2. Changes in sex hormones by age category.

The mean ± SD TT (nmol/L), FT (nmol/L), SHBG (nmol/L), E2 (pmol/L), FSH (IU/L), LH (IU/L), PROG (nmol/L), TSI (nmol/IU), FTI, T/E2 and E2/SHBG grouped by age are shown by curves. The age categories are the same as in Fig. 1. SHBG, FT and T/E2 increased with age (shown by filled symbols), but the others declined (shown with hollow symbols). FSH, LH, SHBG, FT, FTI, TSI, FE2, E2/SHBG and PROG had a linear relationship with age, and the R2 values of their linear equations were 0.92, 0.94, 0.97, 0.88, 0.99, 0.92, 0.85, 0.96 and 0.90. Significant differences between age groups (P<0.01) were observed in FSH, LH, SHBG, FTI, TSI, FE2, and E2/SHBG.
