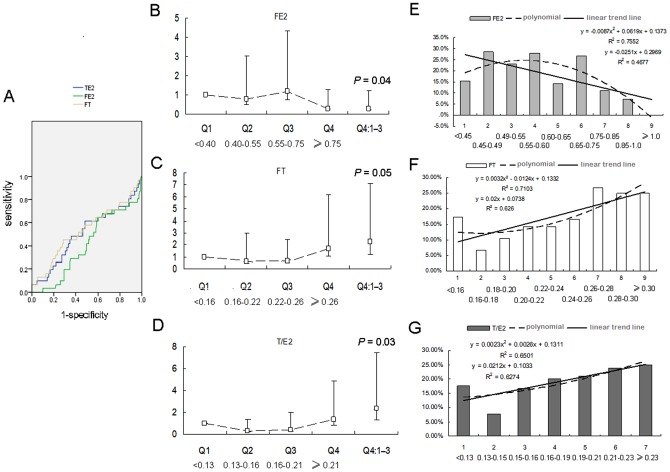
Figure 3. Trend lines of FT, FE2, and T/E2 and CEVD in elderly men.
ROC curves of FT, FE2 and T/E2 are shown in 3A. Using men in quartile 1 (Q1) as a reference, the risk of CEVD of Q2, Q3, and Q4 are shown in Fig. 3B–D. “Q4:Q1–3” means the risk of CEVD of Q4 compared to the pool of Q1–3. We divided quartiles 2–4 of FE2, FT and T/E2 into 8, 8 and 6 groups by increments of 0.05 pmol/L, 0.02 nmol/L and 0.01 units, respectively (10 to 20 people per group). The trend lines and equations are shown in Fig. 3E–G.

