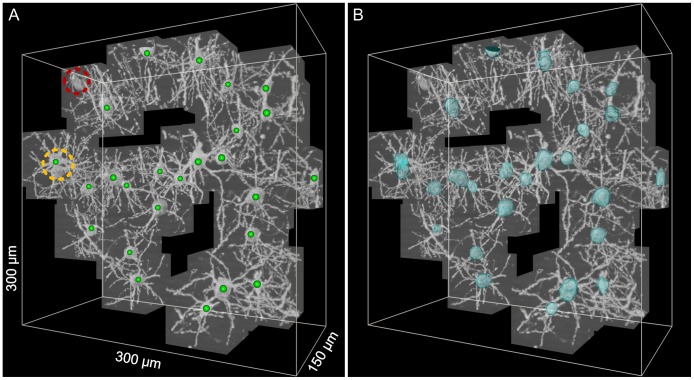
Figure 7. The results of soma location and surface detection for image stack 1.
(A) The located soma centroids (green spheres) for image stack 1 were overlaid on the extracted image stack. The red circle indicates a missing soma; the yellow circle indicates the falsely detected soma (two somas were detected as only one soma). (B) The detected soma surface (green) for image stack 1 was overlaid on the original image stack. The automatically detected soma surfaces are shown in transparent blue and overlaid on the extracted image stacks.

