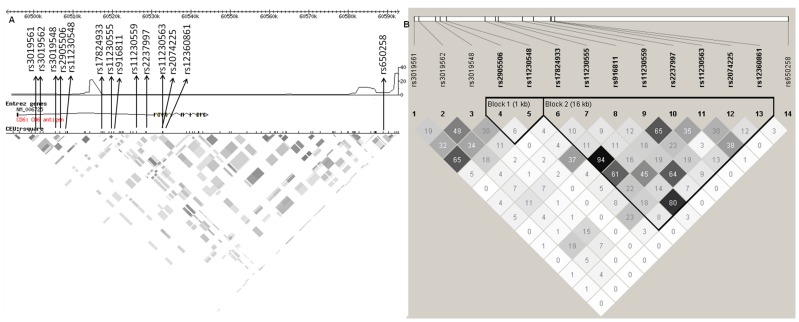
Figure 1. Locations of the 14 Stage 1 SNPs and their linkage disequilibrium (LD) patterns at the CD6 locus.
(A) LD block images with the approximate locations of the 14 SNP markers chosen for this study, recombination spots and LD patterns within the CEU LD plot (Hapmap, version 27) of the CD6 gene, and (B) LD patterns in the northern Spanish-Basque population using the confidence interval method (Gabriel et al. [54]; generated using the Haploview software).

