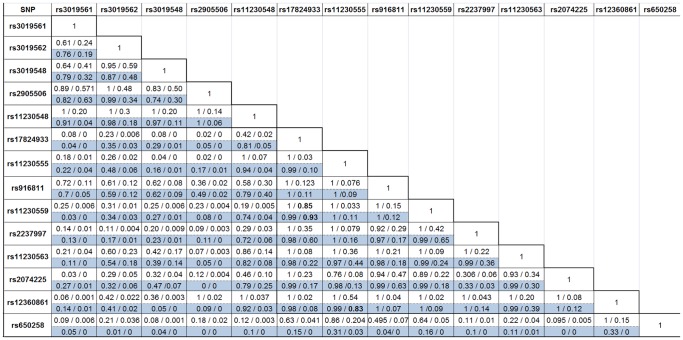
Figure 2. LD values (D’/r2 values) between each of the 14 SNP markers genotyped in the Spanish-Basque population.
The figure represents a comparison of the LD values between the 14 SNPs genotyped in the northern Spanish-Basque population (D’/r2 values) using the values from the CEU 1000 genomes project and from the data generated from the Spanish-Basque population (823 cases/814 controls). The values in white are the D’/r2 values from the CEU 1000 Genomes Project, while the blue-shaded ones are generated for the northern Spanish-Basque dataset using Haploview software (version 4.2).

