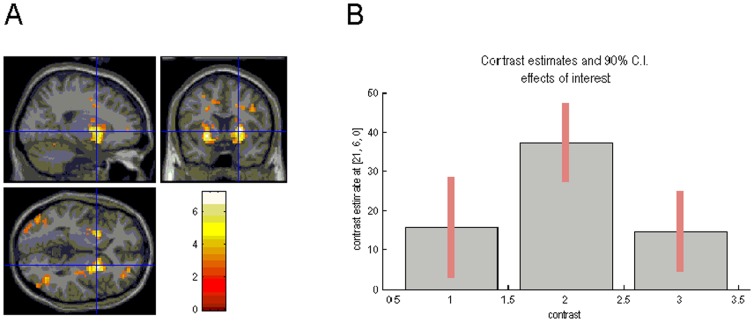
Figure 2. Task main effects and plot of effect sizes.
(A) Task main effects for switching, superimposed on sagittal, transaxial and coronal slices from a canonical (MNI [Montreal Neurological Institute] compatible) T1 image as supplied by SPM. Enhanced BOLD responses are shown in the putamen bilaterally. (B) A plot of effect size in the left putamen is displayed for all three groups (MNI coordinates: x = −21, y = 6, z = 0), showing increased activation in this brain area for patients with obsessive-compulsive disorder (OCD) relative to patients with major depressive disorder (MDD) and the control group.

