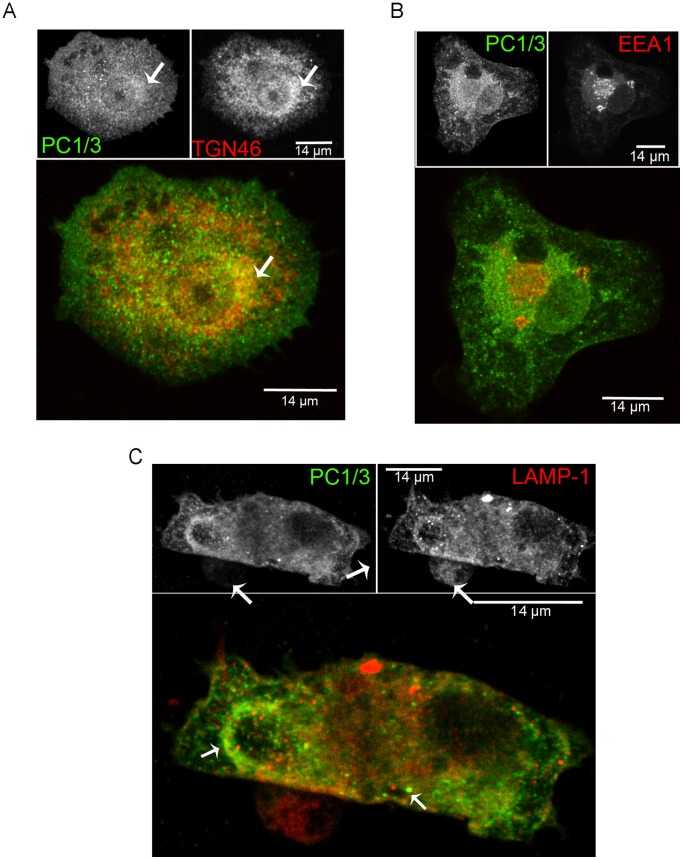
Figure 3. PC1/3 cellular distribution in NR8383 cells as examined by immunofluorescence.
Indirect immunofluorescence confocal microscopy with anti-PC1/3 (green), (A) anti-TGN46 (red), (B) anti-EEA1 (red) and (C) anti-LAMP1 (red). A. The arrow indicates the TGN region where PC1/3 and TGN46 co-localize. C. The left arrow indicates the phagocytic structure and the lower right arrow indicates the lysosome-like structure where PC1/3 and LAMP1 are partially co-localized.

