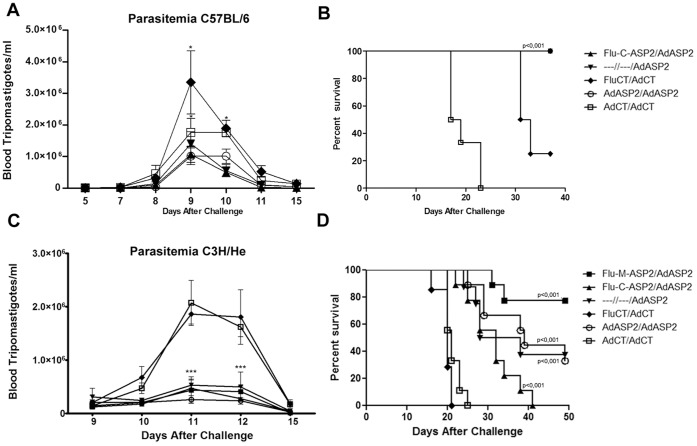
Figure 4. Parasitemia and survival curves of immunized mice challenged with T. cruzi.
B6 and C3H/He mice were immunized as described in Material and Methods. Four weeks after boost immunization, they were challenged intraperitoneally with 1000 and 500, respectively, T. cruzi Y strain bloodstream trypomastigotes. Parasitemia was monitored on blood and depicted as the number of bloodstream trypomastigotes per milliliter of blood (A, n = 4; C, n = 8). The survival of vaccinated C57BL/6 (B, n = 7) and C3H/He (D, n = 7–9) mice was followed during 50 days and showed as Kaplan-Meier curves. * p<0.05, *** p<0.001.

