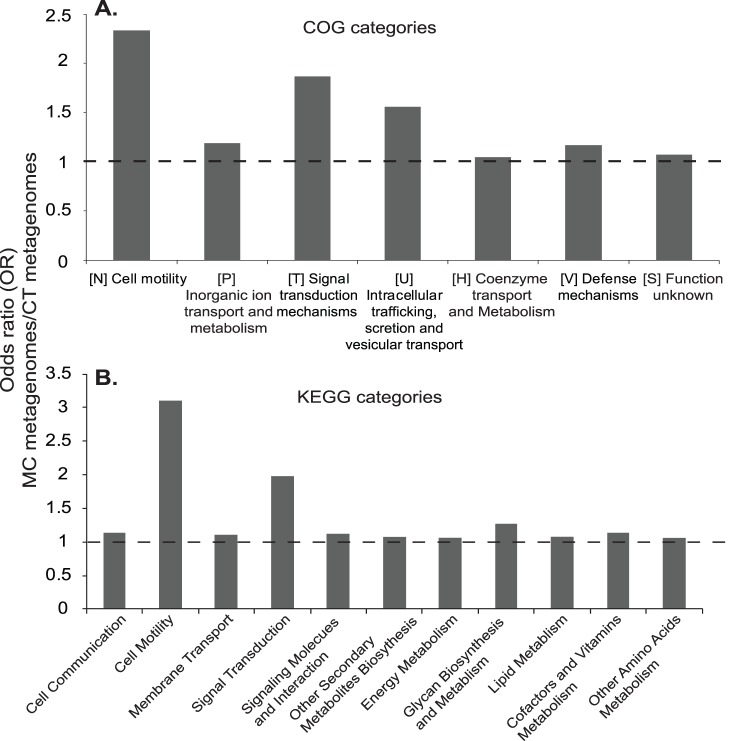
Figure 5. Significantly overrepresented gene categories in the MC metagenomes, relative to those in the CT metagenomes.
(A) General COG categories. (B) General KEGG categories. Calculations were based on relative abundance of each gene categories between the MC and CT metagenomes. Significance overrepresentation was reported when OR>1, P<0.02.

