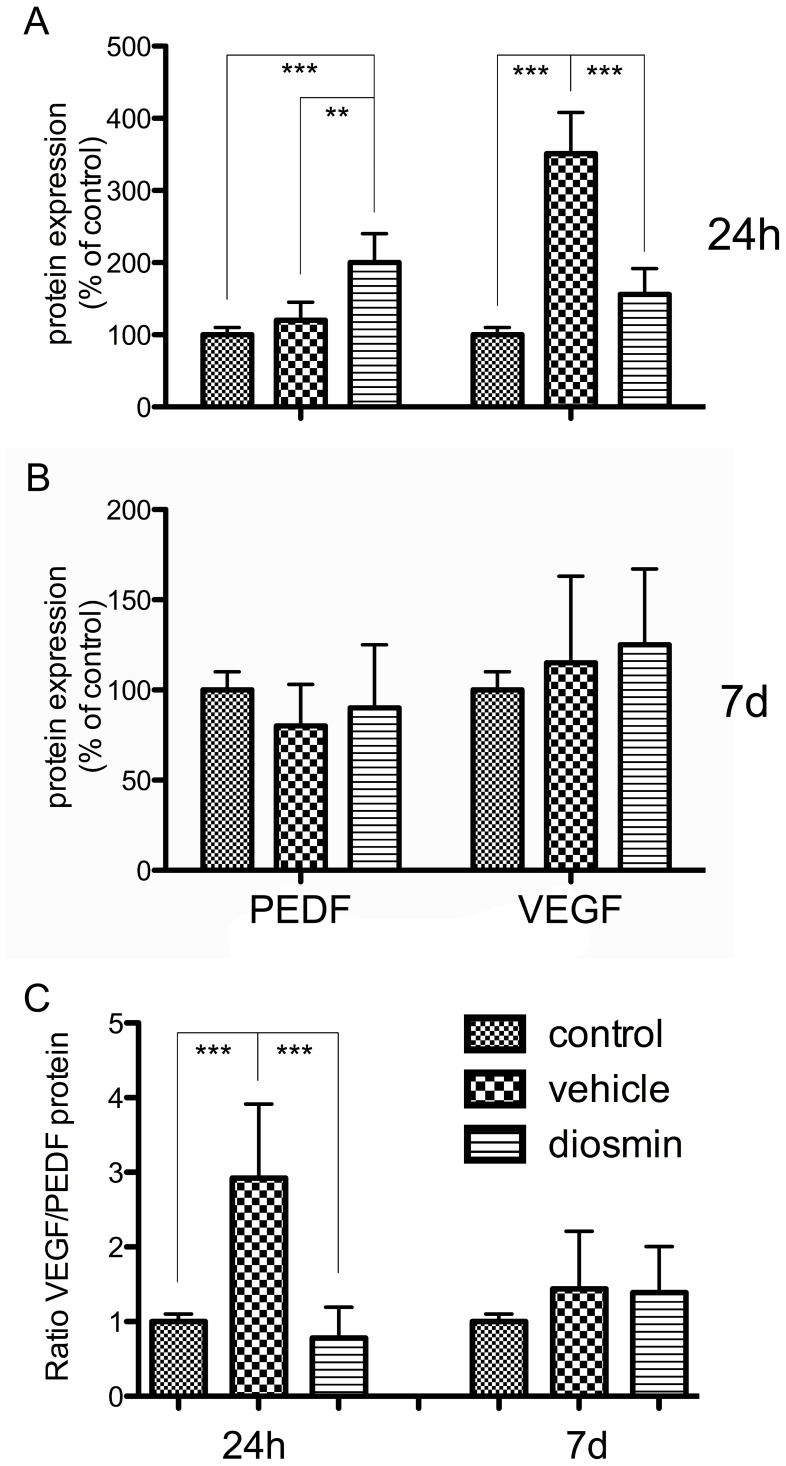
Figure 5. ELISA analysis of VEGF and PEDF protein expression.
(A) Twenty-four hours after ischemia, there was a significant increase in VEGF expression and a slight increase in PEDF expression in the vehicle group compared with the control group; diosmin treatment reversed this trend. (B) Seven days after ischemia, the VEGF and PEDF protein expression returned to normal in both the vehicle and diosmin groups. (C) The VEGF/PEDF ratio for the three groups 24 h and 7 d after ischemia. Data are expressed as the mean±SD (n = 8). **P<0.01, ***P<0.001.

