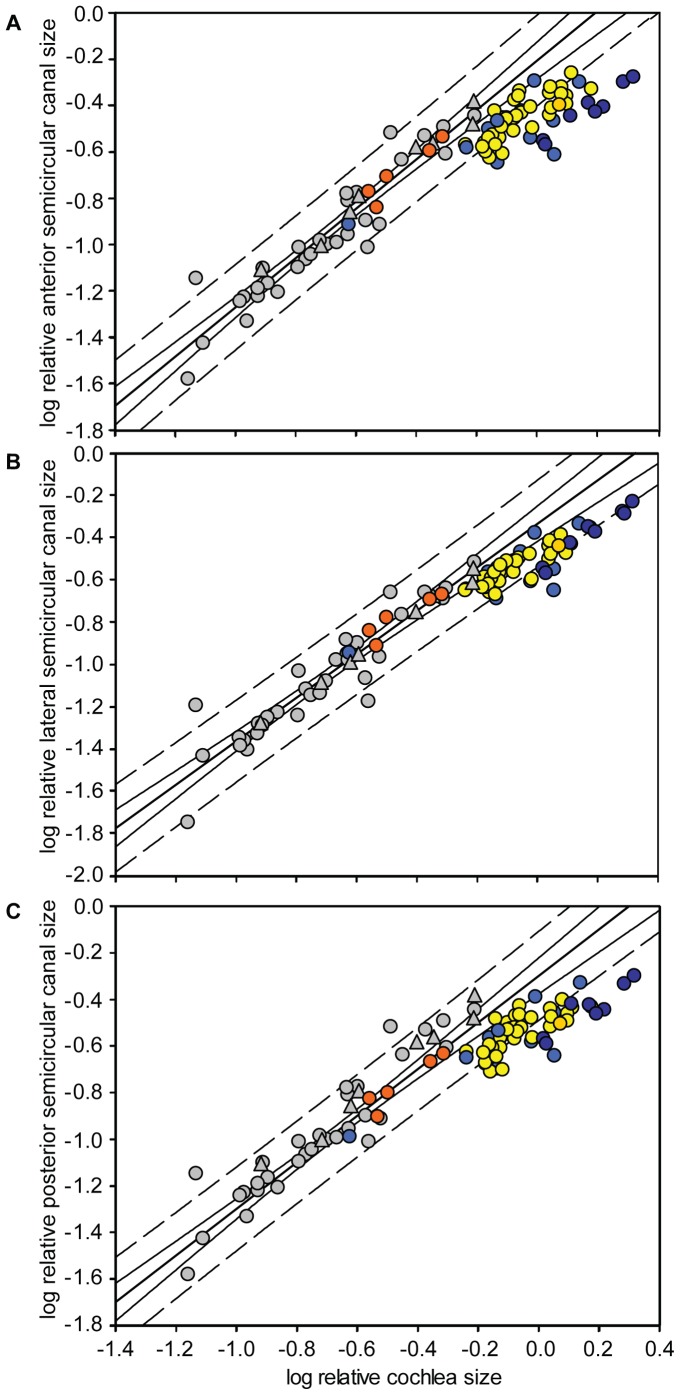
Figure 5. Relative (A) anterior, (B) lateral and (C) posterior semicircular canal size versus relative cochlea size.
The OLS regression of non-bat mammals is shown by the bold line (anterior: r = 0.954, P = 3.48×10⁻²⁰; lateral r = 0.946, P = 1.91×10⁻²¹; posterior r = 0.951, P = 7.29×10⁻²¹), and the 95% confidence and prediction intervals are shown by the solid and dashed lines respectively. Non-bat placental mammals (grey circles) and marsupial mammals (grey triangles) from Spoor et al. [17]. Pteropodidae (orange circles), Yangochiroptera (yellow circles), Pteronotus parnellii (gold circle), Rhinolophidae (dark blue circles), and remaining echolocating Yinpterochiroptera (medium blue circles) represent the bat species included by this study.

