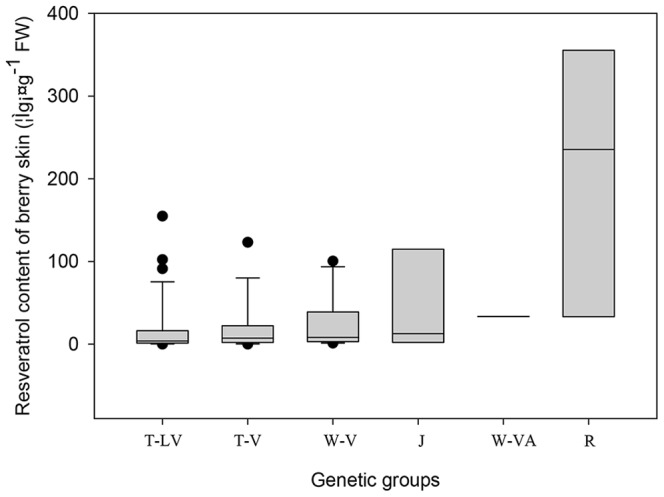
Figure 1. Range and distribution of total resveratrols in grape skins.

The horizontal lines in the interior of the box are the median values. The height of a box is equal to the interquartile distance, indicating the distribution for 50% of the data. Approximately 99% of the data falls inside the whiskers (the lines extending from the top and bottom of the box). The data outside these whiskers are indicated by solid spots. T-LV, T-V, W-V, J, W-VA and R represent the germplasm groups as in Table 1.
