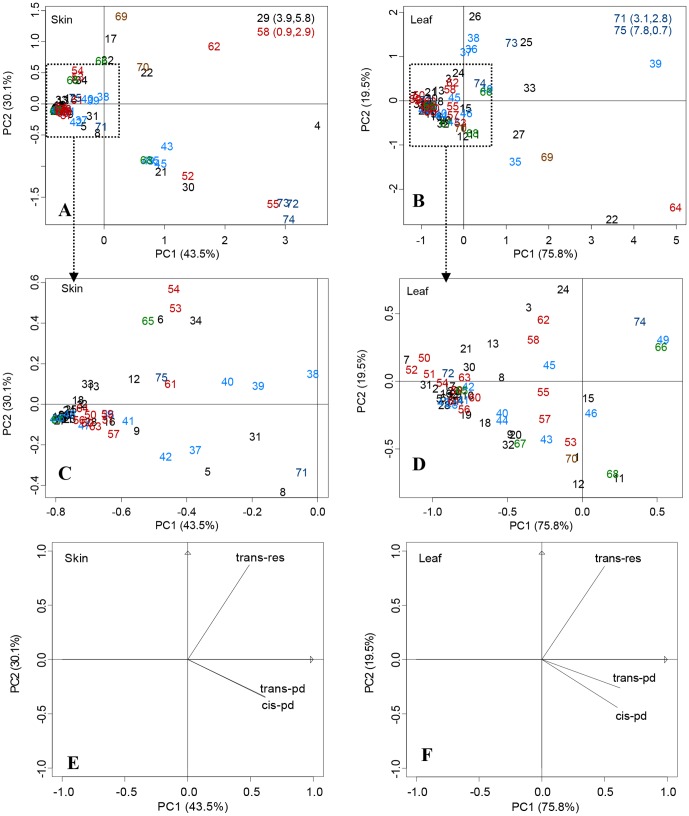
Figure 3. Principal Component Analysis (PCA) of seventy five grape berry skins and leaves.
Fig. 3A and Fig. 3C: Scores scatter plot of PCA in berry skins; Fig. 3E: Loadings plot of PCA in berry skins; Fig. 3B and Fig. 3D: Scores scatter plot of PCA in leaves; Fig. 3F: Loadings plot of PCA in leaves. Percentages in parentheses represent the variance of each component. The numbers in the figure represent the sample numbers, which correspond to those in Table 1. Cultivars 1 to 34 are table grapes from hybrids between V. labrusca and V. vinifera; 35 to 49 are table grapes of V. vinifera; 50 to 64 are table grapes of V. vinifera; 65 to 68 are juice grapes; 69 and 70 are wine grapes of V. vinifera × V. amurensis; and, 71 to 75 are rootstock cultivars.

