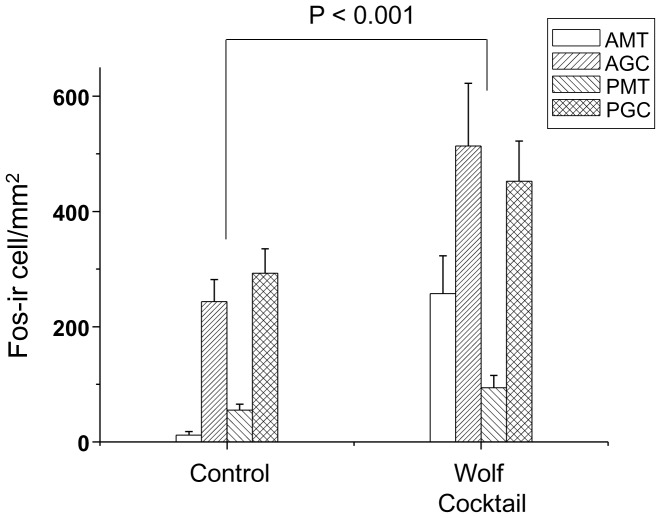
Figure 7. Density of Fos-immunoreactive cells (number of cells/mm2) in the GC and MTC layers in the anterior and posterior regions of the AOB after exposure to water or pyrazine cocktail.
The density of Fos-immunoreactive (Fos-ir) cells in the AMT, AGC and PGC layers was higher after exposure to the pyrazine cocktail vs. the water control (P<0.001).

