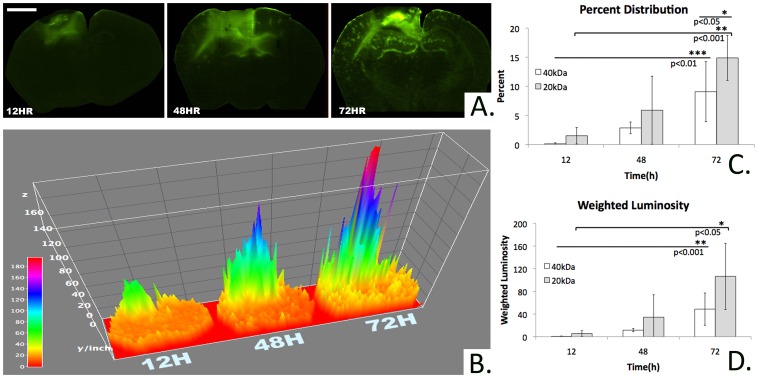
Figure 3. Area and intensity of marker diffusion over time.
A)Fluorescent microscopic images demonstrating an increase in area and intensity of transmucosal rhodamine-dextran delivery over time(bar = 1 mm, bregma −1.06 mm, 40 kDa rhodamine-dextran). B) 3-D map of Fig. 3A quantifying increase in relative pixel luminosity intensity across each cross section over time(bregma −1.06 mm, 40 kDa rhodamine-dextran). C) Percent of the total cross sectional area containing detectable rhodamine fluorescence at bregma −1.06 mm. The overall trend describes an increasing percent area of staining as time increases and molecular weight decreases. Among the 40 kDa conditions, the percent area of rhodamine staining at 72 h is significantly greater than at 12 or 48 h. Among the 20 kDa conditions the percent area of rhodamine staining at 72 h is significantly greater than at 12 h. At 72 h, the percent area subtended by the 20 kDa condition is significantly greater than that of the 40 kDa condition. D) Weighted luminosity of rhodamine staining at bregma −1.06 mm. The overall trend describes an increasing weighted luminosity as time increases and molecular weight decreases. Among the 40 kDa conditions, the weighted luminosity at 72 h is significantly greater than at 12 or 48 h. Among the 20 kDa conditions, the weighted luminosity at 72 h is significantly greater than at 12 h.

