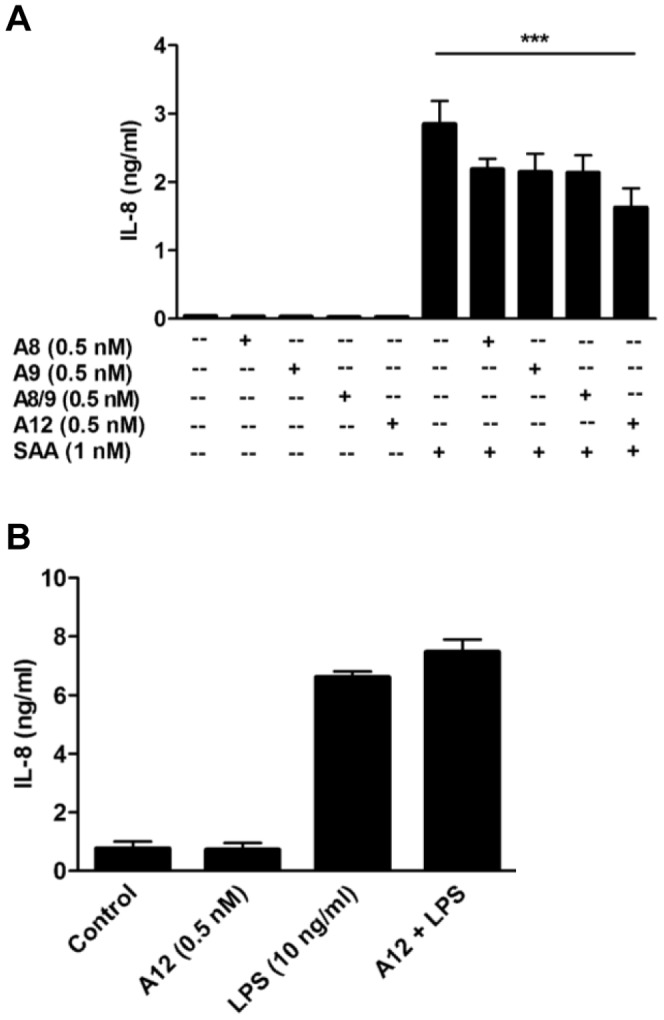
Figure 2. Suppression of SAA-induced IL-8 was specific to S100A12, and S100A12 did not reduce LPS-induced IL-8.

(A) THP-1 cells incubated with SAA (1 nM) ± S100A8, S100A9, S100A8/S100A9 complex or S100A12 (0.5 nM) for 15 h, and IL-8 levels detected by ELISA. Data are means ± SEM of duplicate assays from four separate experiments; ***p<0.005 compared to SAA alone (analyzed by one-way ANOVA with Bonferroni’s correction for multiple comparison tests). (B) THP-1 cells treated with S100A12 (0.5 nM), LPS (10 ng/ml) or LPS+S100A12 for 15 h and IL-8 levels in supernates quantitated. Values are means ± SEM of duplicate assays from two independent experiments.
