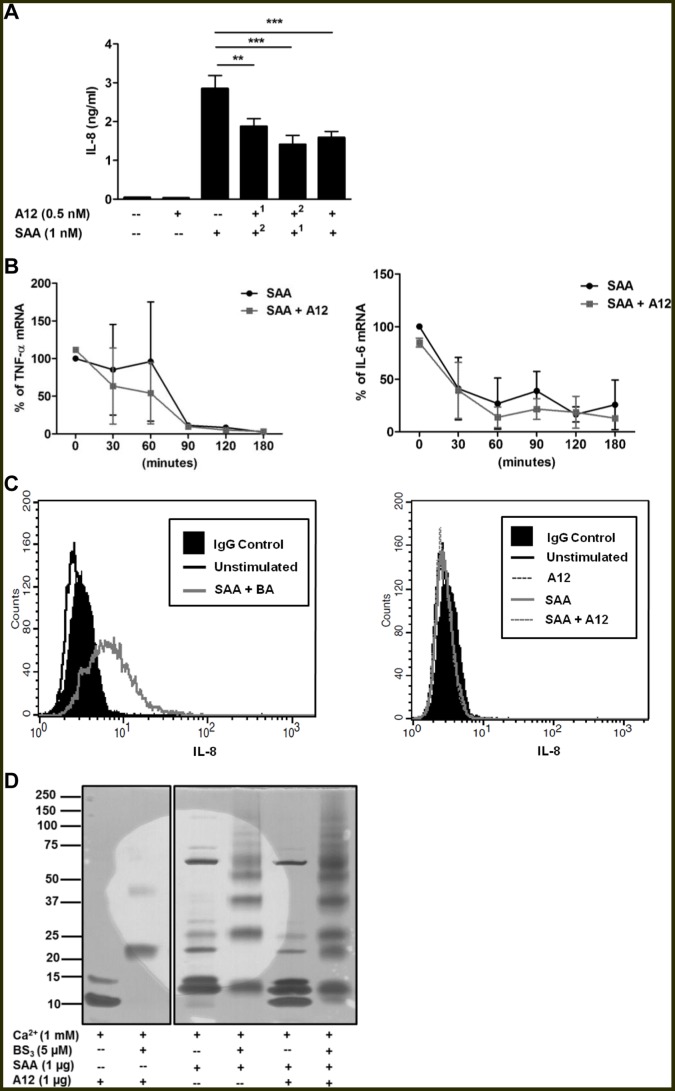
Figure 4. S100A12 suppression was not due to receptor competition, cytokine mRNA stability or defective IL-8 secretion.
(A) To determine whether S100A12 or SAA competed for putative shared receptors, THP-1 cells were pre-incubated with S100A121 or SAA1 for 30 min (where indicated) before addition of SAA2 or S100A122 (where indicated), respectively, then cultures incubated for 15 h; IL-8 levels detected by ELISA. Data expressed as means ± SEM of duplicate assays from at least four separate experiments. **p<0.01 and ***p<0.005 compared to SAA alone (analyzed by one-way ANOVA with Bonferroni’s correction for multiple comparison tests). (B) Half-lives of (left panel) TNF-α and (right panel) IL-6 mRNA in THP-1 cells stimulated with SAA (1 nM) ± S100A12 (0.5 nM) determined by real-time RT-PCR. Data represents % TNF-α and IL-6 mRNA levels relative to β-actin mRNA levels; means ± SEM of duplicate assays from two independent experiments are shown. (C) Histograms from flow cytometric analysis of intracellular IL-8 levels in THP-1 cells. Solid black profiles represent IgG control; the black, grey or broken lines represent intracellular IL-8 levels measured 15 h post-stimulation. (C, left panel) THP-1 cells treated with SAA (1 nM)+brefeldin A (5 ng/ml) was the positive control; BA, brefeldin A. (C, right panel) THP-1 cells treated with SAA (1 nM), S100A12 (0.5 nM) or SAA+S100A12. Results from a single experiment, representative of three, are shown. (D) Chemical cross-linking did not identify S100A12-SAA complexes. S100A12 (1 µg) was cross-linked with SAA (1 µg) using bis[sulfosuccinimidyl] suberate (5 µM) in the presence or absence of 1 mM Ca2+. The gel shown is representative of two separate experiments. Gel from the same experiment was cropped to highlight relevant cross-linked treatments for the study. BS3, bis[sulfosuccinimidyl] suberate.

