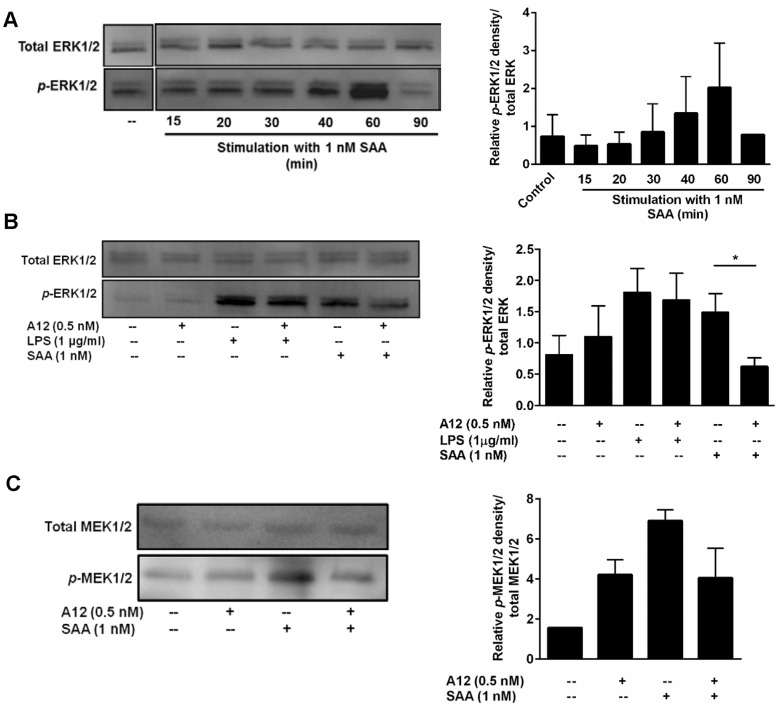
Figure 6. S100A12 decreased SAA-induced ERK1/2 and MEK1/2 phosphorylation.
(A) Time course of SAA-induced p-ERK1/2 in THP-1 cells treated with SAA (1 nM) for the times indicated. (B) THP-1 cells treated with SAA (1 nM) ± S100A12 (0.5 nM) or LPS (1 µg/ml) ± S100A12 (0.5 nM) for 60 min. Western blotting performed with Ab against phospho-p44/42 (ERK1/2) MAPK. Anti-p44/42 (ERK1/2) MAPK Ab was used as a control for protein loading. Western blots shown are representative of (A) two or (B) three separate experiments. (A and B, right panels) Intensities of bands corresponding to p-ERK1/2 (44 and 42 kDa) were quantified by densitometry, and expressed as means ± SEM from two or three separate experiments, respectively; *p<0.05 compared to SAA alone (analyzed by one-way ANOVA with Bonferroni’s correction for multiple comparison tests). Western blots in (A) from the same experiment were cropped to highlight relevant treatments for the study. (C) THP-1 cells treated with SAA (1 nM) ± S100A12 (0.5 nM) for 60 min. Western blotting performed with Ab against phospho-MEK1/2 (Ser217/221). Anti-MEK1/2 Ab was used as a control for protein loading. Western blot shown is representative of two separate experiments. (C, right panel) Intensities of bands corresponding to p-MEK1/2 (45 kDa) were quantified by densitometry, and expressed as means ± SEM from two separate experiments.

