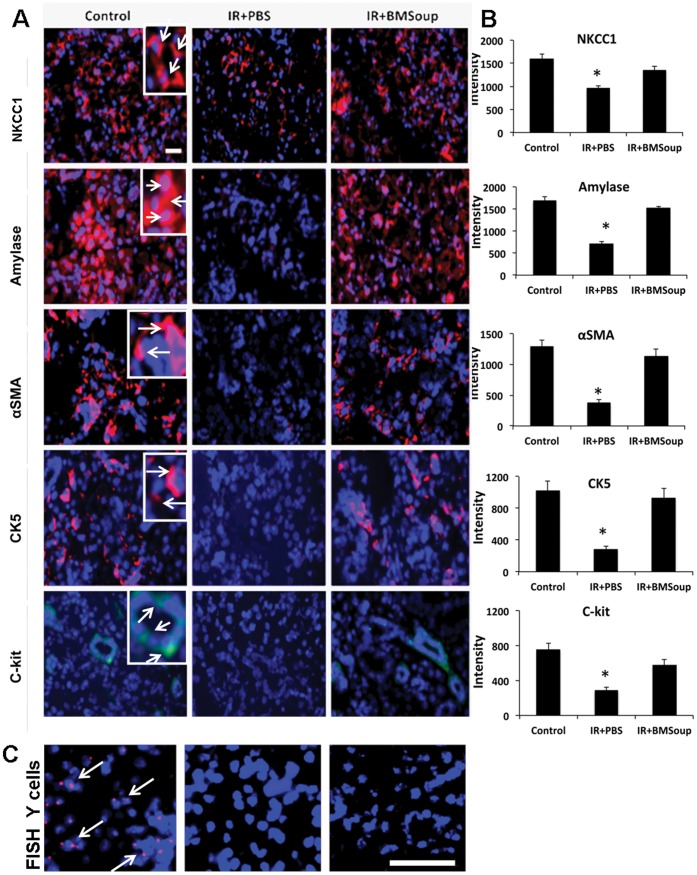
Figure 3. Role of Bone Marrow Soup in cytoprotection.
A. Immunofluorescence staining of specific subpopulations of cells in submandibular glands at 8 wks post-irradiation. Cell markers are shown in red (or green for c-kit); cell nuclei are in blue. BM Soup-treated mice had a higher number of cells positive for NKCC1 and amylase (used here as markers of acinar cells; see white arrows in inset of a magnified region), smooth muscle actin (marker for myoepithlial cells), CK5 and c-kit (markers for ductal and salivary progenitor cells) than PBS-treated mice. All photographs were taken at the same magnification; scale bar (white) is 220 um; inset shows a higher magnification of selected cells. B. Quantification of protein fluorescence (intensity) expressed in 3–5 fields of 400 um2 area/per gland by Volocity software (N = 5 mice per group). BMSoup shows comparable proportions of acinar, ductal, myoepithelial, and stem cells as non-irradiated control/healthy mice. IR+PBS group has less protein intensity when compared to Control or BMSoup-treated mice (*P<0.05). C. Fluorescence in situ hybridization using a Y-chromosomal probe. Left picture with “red dots” localize (expected) male cells in a male mouse salivary gland (positive control). White arrows are pointing to some male cells. Cell nuclei are in blue. Middle picture was taken from a female mouse (negative control; no red cells are seen). Right picture confirmed that BM Soup did not contain any Y-chromosome (male) transplanted cells in female irradiated salivary tissues. White scale bar is 38 um.

