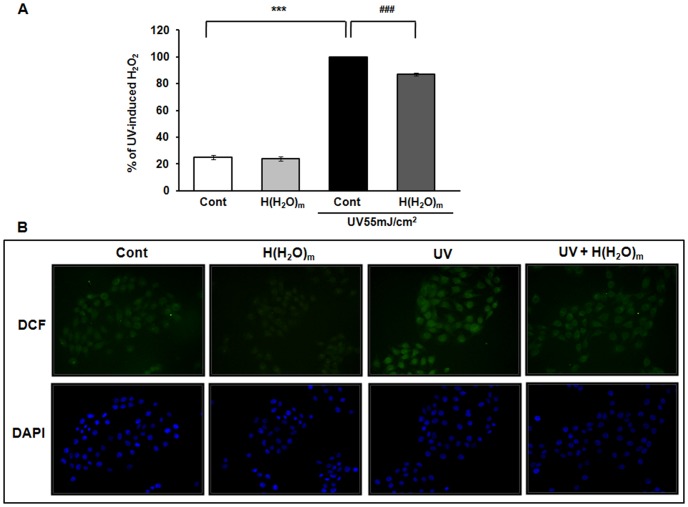
Figure 6. H(H2O)m reduces UV-induced ROS production in HaCaT cells.
(A) Cells were pre-treated with H(H2O)m for 15 min, then irradiated with UV and post-treated with H(H2O)m for 15 min in PBS. Subsequently, cells were treated with DCFDA (25 µM, freshly diluted in pre-warmed DMEM) for 30 min. Cells were then assayed using a fluorescence reader. Values shown are means ± SEM (n = 8), *** p<0.001 versus the control, ### p<0.001 versus UV-treated cells. (B) Intracellular H2O2 levels in HaCaT cells were visualized after DCF staining. The fluorescence intensity was visualized using a fluorescent microscope, and the images presented are representative of the fluorescence levels observed in three separate experiments. To normalize cell number, DAPI was used as a fluorescent marker for the nucleus.

