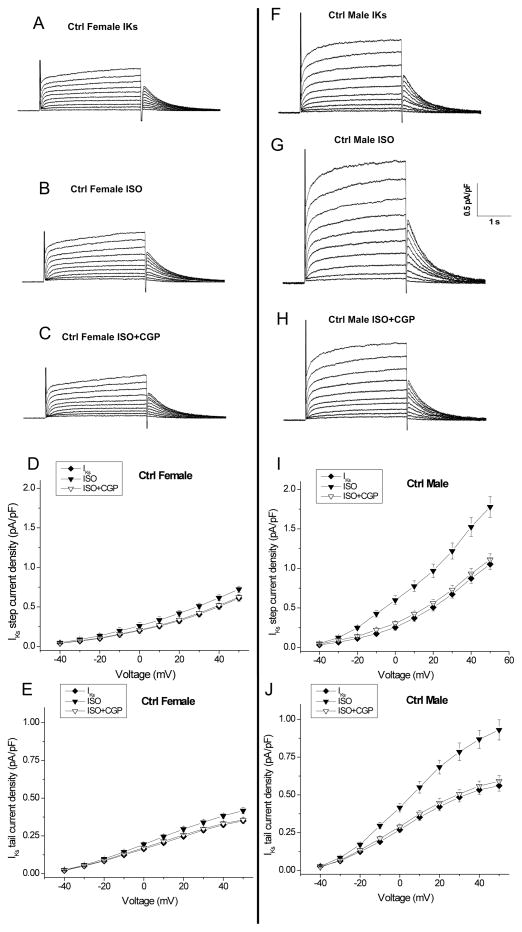
Figure 4. β1-adrenergic stimulation regulates slow delayed-rectifier potassium current in control male and female rabbits.
A–C, Representative IKs traces from control female rabbit myocytes are shown at baseline (A), in the presence of 500nM ISO (B), and after subsequent addition of 300nM CGP 20712A (β1-adrenergic receptor blocker) (C) at test potentials ranging from −40 and +50 mV. D & E, Summarized data for step and tail current-voltage (I-V) relationship for IKs in control females (n=5 (5 hearts)). Currents are normalized to cell capacitance. Density of peak currents (mean ± SEM) were plotted vs test potentials. F–H, Representative control male IKs traces are shown at baseline, in the presence of 500nM ISO, and after subsequent addition of 300nM CGP 20712A. I–J, Summarized step and tail current-voltage (I-V) relationship for IKs at baseline and in the presence of 500nM ISO ± 300nM CGP 20712A in control male myocytes (n=9 (9 hearts)).

