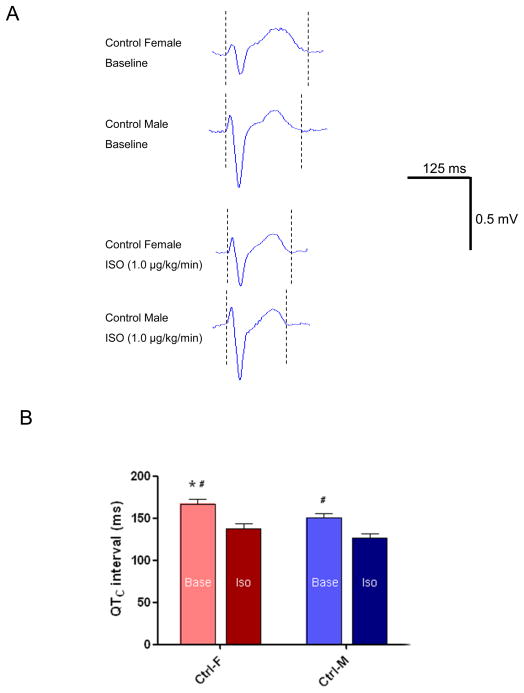
Figure 8. Sex differences in QTC interval in response to isoproterenol.
A, Representative surface ECG recordings at baseline and in response to isoproterenol (ISO, 1 μg/kg/min) in control female and male rabbits. B, Summarized data for QTC intervals at baseline and in response to ISO from control females and males (, p<0.05 vs Ctrl-M; #, p<0.05 vs ISO).

