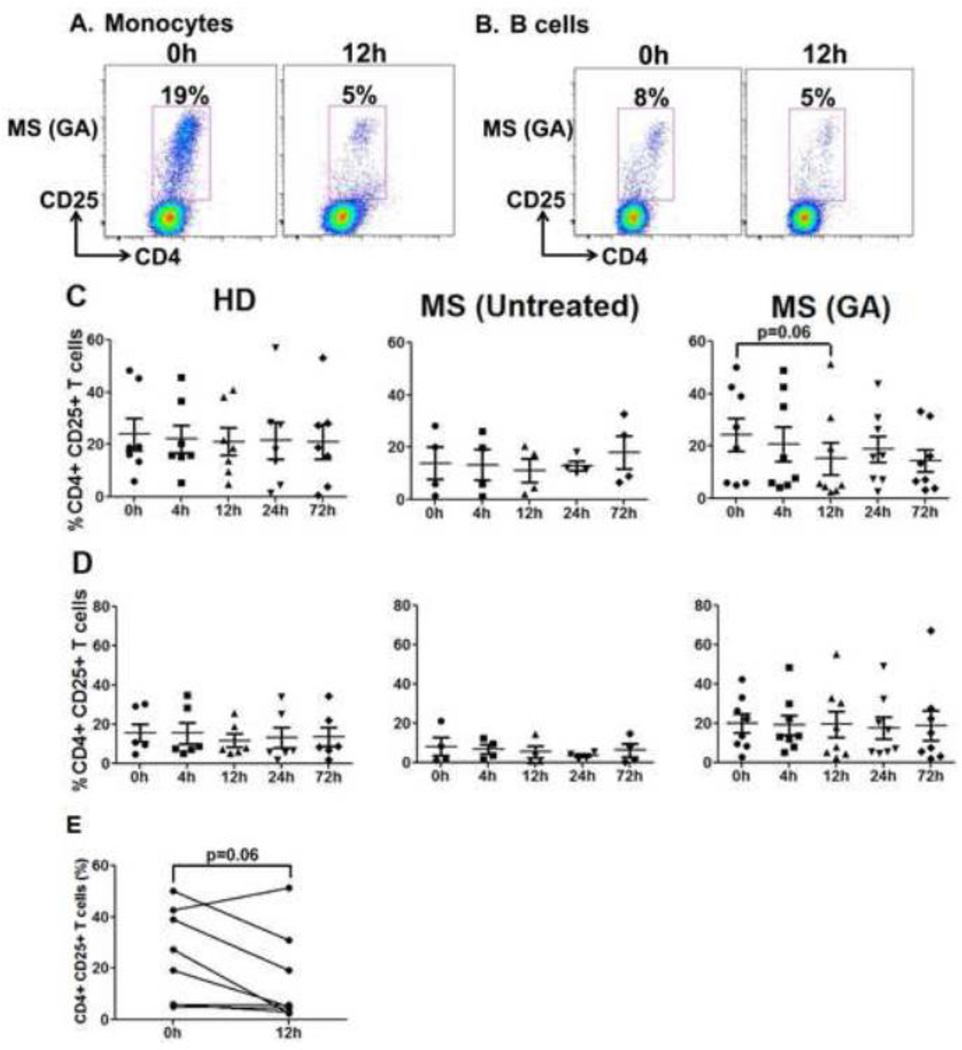
Figure 10. Striking reduction in monocyte stimulatory potential at 12h after GA treatment.
Monocytes and B cells were isolated from HD, untreated and GA treated MS patients and were co-cultured with CD4+CD25− Teff cells from third party donors for 6 days. The cells were harvested, washed, stained with anti-CD4 & CD25 and analyzed by flow cytometry. CD25 upregulation on CD4+ T cells was assessed to measure activation potential of study participants’ monocytes and B cells. Panels A and B show representative dot plots of Teff cells cultured with GA-treated patient’s monocytes and B cells, respectively, obtained at 0h and 12h. Data points in Panels C and D represent %CD25 on gated CD4+ T cells. Monocytes at 12h post-GA treatment displayed reduced stimulatory potential with a trend towards significance (Panel C). As shown in Panel E, monocyte stimulatory potential in MLR displayed a reduced trend in 7/8 GA-treated MS patients at 12h after treatment initiation. B cells did not show any fluctuations in stimulatory potential in all the three groups during the 72h observation period (Panel D).

