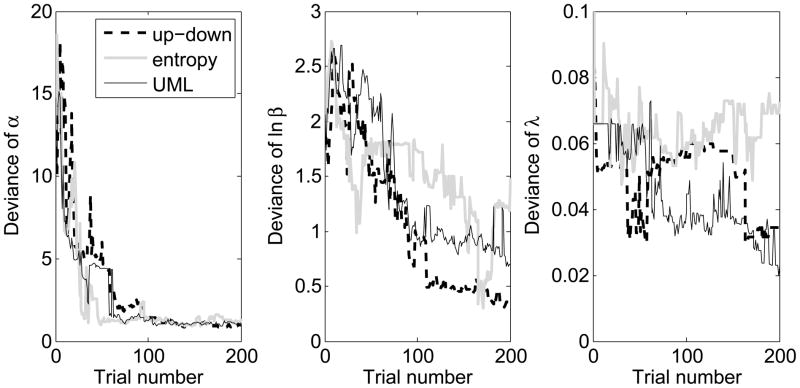
Figure 1.
The rms deviations between the parameter estimates and the best parameter estimates of the psychometric function as a function of the number of trials for Experiment I. Changes in the functions indicate the rate at which the parameters converge for three parameters, α, ln β, and λ (left to right panels). The up-down staircase procedure, the entropy-based Bayesian procedure, and the updated maximum-likelihood (UML) procedure are plotted with different line styles.

