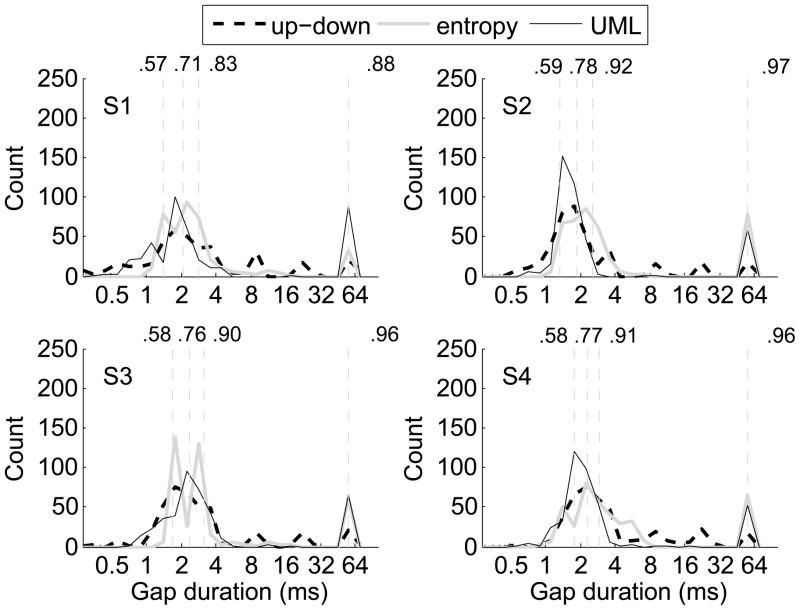
Figure 2.
The histograms of the gap durations tested for the up-down staircase procedure, the entropy-based Bayesian procedure, and the updated maximum-likelihood (UML) for Experiment I. Results for individual listeners are plotted in separate panels. Within each panel, the vertical lines mark the sweet points derived from the best estimate of the psychometric function using the pooled data across procedures and repetitions. The proportions correct at the sweet points are labeled above the vertical lines.

