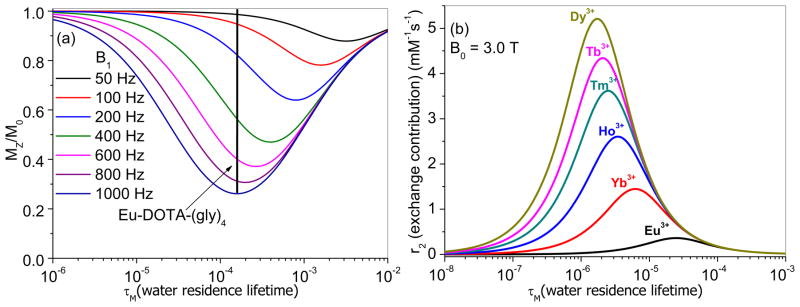
Figure 4.

Simulated curves showing the effect of water residence lifetime (τM) on CEST contrast (Mz/M0) and r2exch contrast. (a) The colored curves are for different saturation powers (B1) ranging from 50–1000 Hz. The parameters used in Bloch equation simulation include Cbound protons = 40 mM, Cbulk protons = 111 M, T1bulk = 2.5 s, T1bound water = 0.2 s, and T2bound water = 0.1 s. (b) r2exch (the contribution to the bulk water linewidth due to chemical exchange) for various lanthanide complexes with different bound water chemical shifts (Δω) at 3T. Note that the CEST plot is independent of field strength while the r2exch plot varies strongly with magnetic field.
