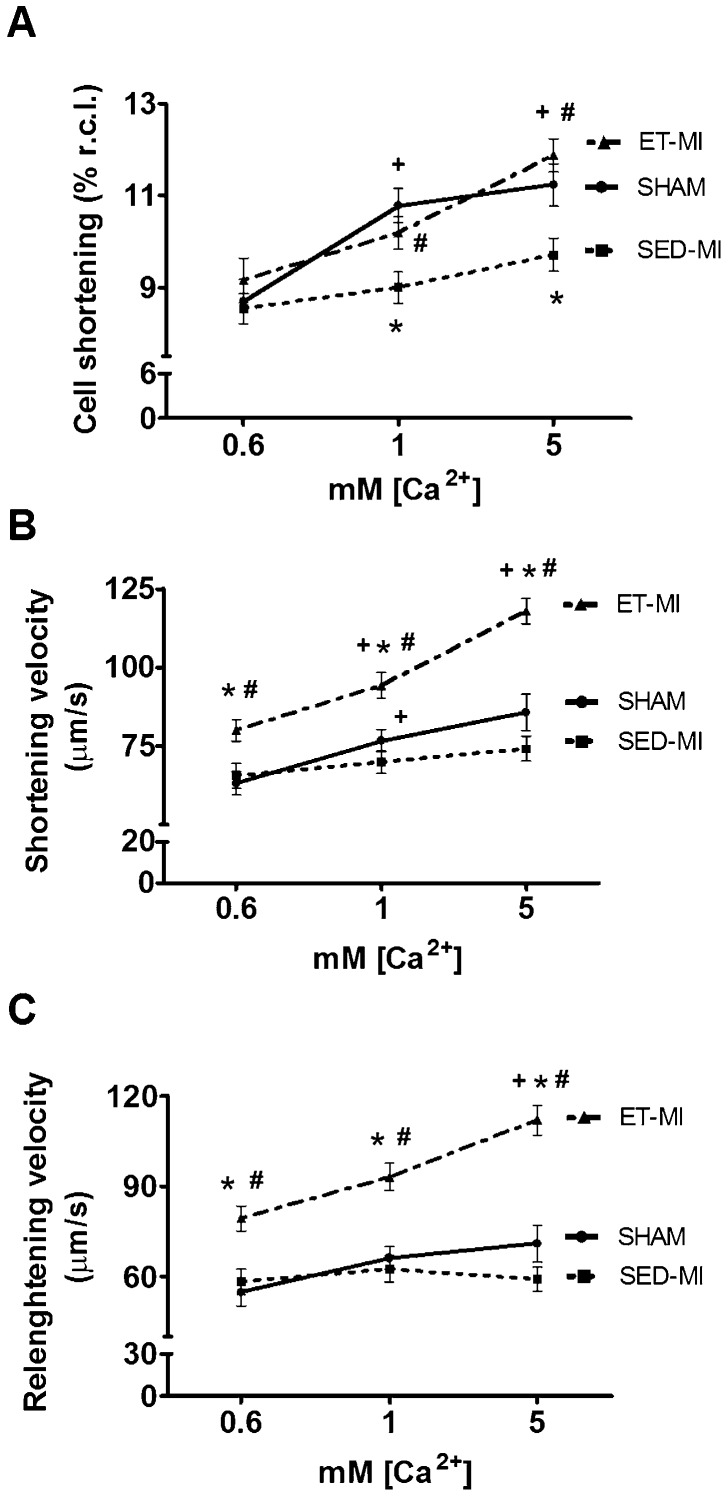
Figure 5.
Cardiomyocyte contractile function. A Cell shortening (% of resting cell length). B Shortening velocity. C Relengthening velocity. SHAM, control. SED-MI, sedentary and given MI. ET-MI, exercise trained and given MI. Data are presented as the mean±SEM. *p<0.05 vs. SHAM; #p<0.05 vs. SED-MI. +p<0.05 vs. lower [Ca+2] (Kruskal-Wallis followed by Dunn's test).

