
Fig. 6.
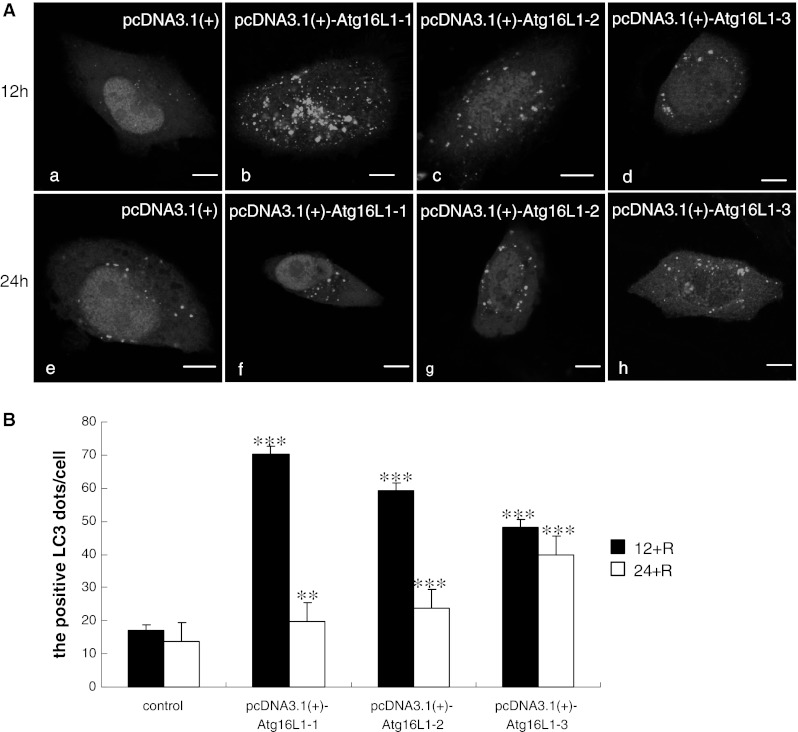
Confocal fluorescence microscopy of Atg16L1 wild-type and isoforms cotransfected HeLa cells with GFP–LC3 (green) with rapamycin induction for 12 and 24 h. a HeLa cells were cotransfected with pEGFP–LC3 and pcDNA3.1(+), or pcDNA3.1(+)–Atg16L1 as described in “Materials and methods” section. After 48 h incubation, the cotransfected cells were induced with rapamycin for further 12 h (a–d) and 24 h (e–h), respectively, and were imaged by microscopy. Scale bars 10 μm. b Quantification of dot-shaped GFP–LC3 signals in HeLa cells stimulated as described above. Data were represented as mean ± SEM; **P < 0.01 versus control, ***P < 0.001 versus control. (Color figure online)