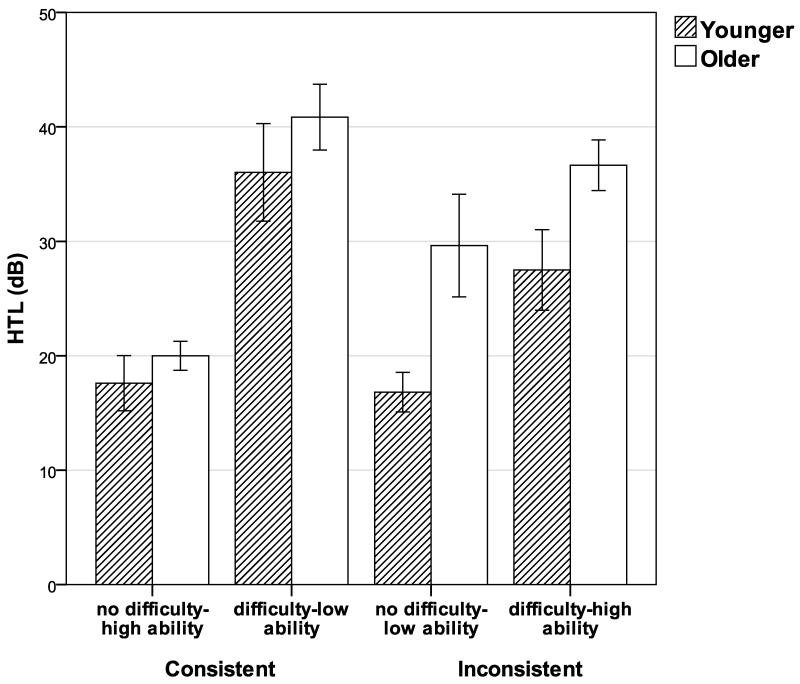
Figure 2.
Hearing threshold levels (HTL) averaged across 0.5, 1, 2 and 4 kHz, both ears, for eight stratified samples: Consistent — no-difficulty/high-ability/younger (n=19), no difficulty-high-ability/older (n=6), yes-difficulty/low-ability/younger (n=23), yes-difficulty/low-ability/older (n=19); Inconsistent —no-difficulty/low-ability/younger (n=15), no-difficulty/low-ability/older (n=10), yes-difficulty/high-ability/younger (n=23), yes-difficulty/high-ability/older (n=26). Error bars represent standard error (±1).

