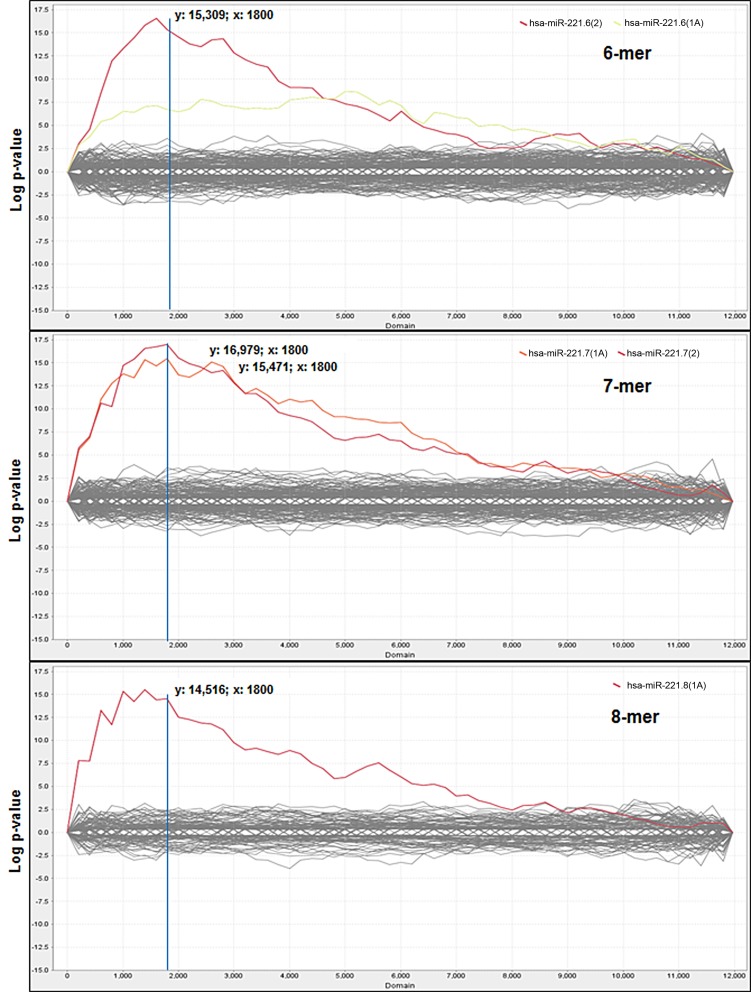
Figure 1.
Sylamer enrichment landscape plots. Plots show the 6nt, 7nt, and 8nt seed complementary enrichment profiles. The graph shows that the words complementary to the seed region of miR-221 (in red and orange) clearly separate from the background, which consists of the seeds of all the other miRNAs. For each plot the x-axis represents the sorted gene list from the most down-regulated (left) to the most up-regulated (right) mRNAs in miR-221 transfected cells and the y-axis shows the hypergeometric significance of each nucleotide word. The multiple testing bounds for adjusted P < 0.05 is: ±4.286 for 6-mers, ±4.199 for 7-mers, and ±3.923 for 8-mers.

