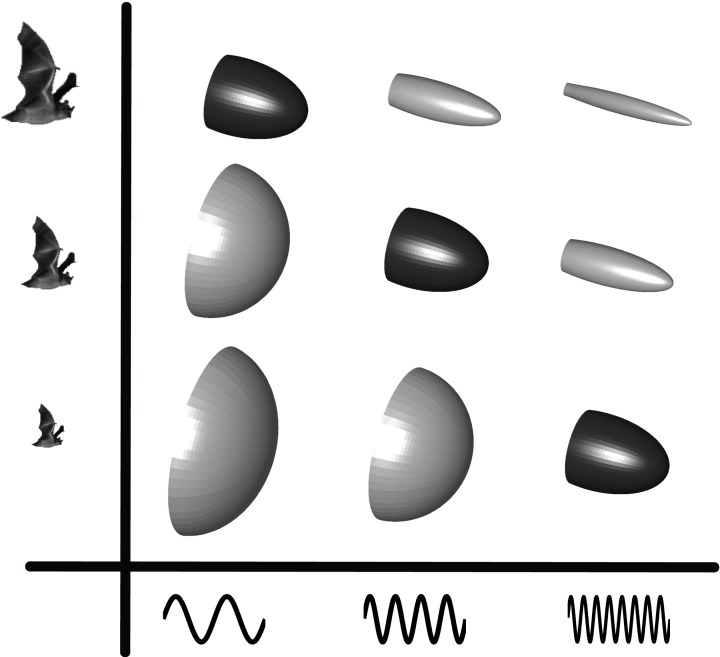
Figure 2.
Echolocation beam shape as a function of emitter size and frequency. The beam-shape schematics illustrate how directionality increases as either frequency or emitter size increase. The highlighted diagonal beam patterns illustrate how bats of different sizes can converge on similar beam patterns by adjusting the emitted frequency to their size i.e., small bats emit higher frequencies than large bats. Figure from Jakobsen et al. (2013).

