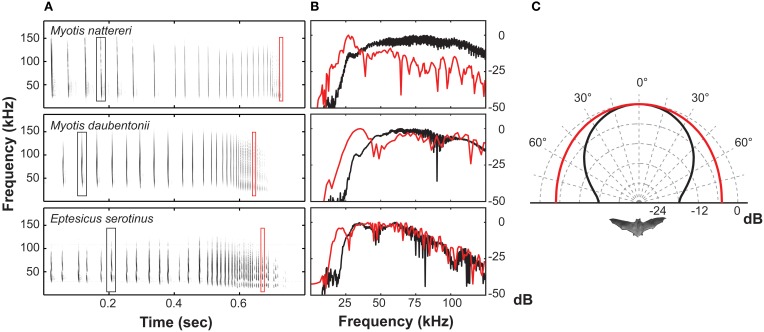
Figure 4.
(A) Spectrograms of three prey-capture sequences from vespertilionid bats. (B) Power spectra illustrating the frequency drop from the approach phase (black trace) to the terminal phase (red trace). (C) Measured directionality for approach signals at 55 kHz (black trace) and for buzz II signals at 27.5 kHz (red trace) for Myotis daubentonii.

